Elementary Overview
OSFEC.016 teaches why a fast microcontroller can still react late to a sensor, a network packet, or a hardware fault. An interrupt is a request for the processor to handle an important event. Interrupt latency is the time between an event becoming actionable and the first instruction of its interrupt service routine (ISR). A processor can be busy or temporarily unable to take a particular interrupt, so a short handler does not guarantee a short response.
Engineers also care about jitter, the variation in response timing across repeated events. A 3 microsecond response on one occasion and a 20 microsecond response on another can matter more than a favorable average. The previous OSFEC.015 flash-consistency lesson addressed sudden interruption during persistent writes. The related OSFTC.017 timer lesson explains time bases and PWM generation. Here, the engineering task is to establish when an event arrived, when its handler ran, and how reliably a waiting thread resumed.
Learning outcomes: distinguish interrupt latency from ISR execution and thread wake-up time; interpret Arm Cortex-M NVIC priorities; calculate response and jitter from timestamps; understand RTOS interrupt-call limits; and design a reproducible, low-impact timing validation plan. All numerical measurements in the examples are hypothetical teaching values.
SEGGER, official SystemView introduction. SEGGER’s original training demonstrates observing interrupt and scheduler behavior in a real embedded trace rather than relying on firmware assumptions. Original video.
Timing boundaries engineers must separate
The physical event may start as a rising input edge, timer compare, peripheral receive flag, or fault condition. The interrupt request may then become pending in the controller. Entry into the handler may be delayed by masking, higher-priority execution, disabled peripheral routing, processor state, bus contention, or implementation-specific exception overhead. A correct test must define its start event and first measurement point.
ISR execution time starts when its instrumented entry point is reached and ends at the corresponding exit point. Event-to-thread latency continues until a task waiting for the ISR’s signal becomes runnable and actually starts running. The latter includes kernel dispatch and interference from higher-priority tasks. An ISR can complete quickly while the application still reacts too late. The earlier real-time scheduling lesson describes the distinction between a hardware response and RTOS execution.
An interrupt’s observed frequency is not its latency. A handler executing every millisecond can have poor worst-case response timing. Likewise, an oscilloscope trace of a toggled pin may include software instructions before the toggle and measurement probe delay. Engineers document those contributions rather than treating GPIO instrumentation as an ideal timestamp.
NVIC priority numbers and nesting
On many Arm Cortex-M devices, the Nested Vectored Interrupt Controller (NVIC) determines which enabled, pending interrupt may execute. A lower numeric priority value denotes a higher logical urgency. Priority zero is commonly the highest configurable external-interrupt urgency, not the lowest. The implementation supports a device-specific number of priority bits, given by __NVIC_PRIO_BITS. Arm’s official CMSIS NVIC reference defines functions such as NVIC_SetPriority, NVIC_GetPriority and priority-grouping helpers.
For a hypothetical Cortex-M design with four implemented priority bits, configurable priority values run from 0 through 15. The CMSIS call NVIC_SetPriority(IRQn, 5) accepts the unshifted logical priority value for a configurable interrupt, while the hardware priority register encodes implemented bits in the most significant portion of its byte. Manually shifting a CMSIS argument again can silently set a wrong level. Arm’s interrupt-priority explanation details the distinction.
On Cortex-M variants supporting configurable priority grouping, some bits can define preemption priority and others subpriority. A higher preemption priority can interrupt a lower one; subpriority alone only resolves ordering of pending requests within a shared preemption level. The allocation varies by core and configuration. Cortex-M0 and M0+ have different capabilities, so priority-grouping examples from larger cores must not be copied automatically.
A worked interrupt response timeline
Suppose an authorized instrument records a hypothetical external event at 100.0 µs, the first marked ISR instruction at 103.6 µs, ISR completion at 109.2 µs, and the awakened application thread beginning at 114.4 µs. The observed event-to-ISR latency is 103.6 − 100.0 = 3.6 µs. The marked ISR body runs for 109.2 − 103.6 = 5.6 µs. Event-to-thread response is 114.4 − 100.0 = 14.4 µs.
At a hypothetical constant 160 MHz core clock, 3.6 µs corresponds to 3.6 × 160 = 576 clock cycles. That conversion is only a representation at the assumed frequency, not the processor’s architectural exception-entry cycle count. A low-power transition, clock change, tracing overhead, or external measurement offset can make the interpretation more complicated. The 5.2 µs interval from ISR completion to thread start is also not automatically pure scheduler overhead; other work may have executed.
For five hypothetical response samples of 3.2, 3.8, 4.1, 3.3 and 7.0 µs, the arithmetic mean equals 4.28 µs; the worst observed response is 7.0 µs, and the simple max-minus-min span is 3.8 µs. The span is one descriptive measure of variation, not a standard deviation or a proven worst-case execution bound. Five samples cannot establish a certified worst-case latency.
Priority masking and FreeRTOS restrictions
An RTOS port may temporarily mask some interrupt priorities while manipulating kernel data. For supported Cortex-M FreeRTOS ports, configMAX_SYSCALL_INTERRUPT_PRIORITY and the corresponding library-oriented constant define the priority region from which interrupt-safe kernel APIs may be called. A logically higher-priority ISR, numerically below the configured ceiling, must not call a prohibited FromISR API merely because it runs quickly.
Priority values supplied in some FreeRTOS configuration macros are already shifted into hardware-register position, while CMSIS NVIC_SetPriority expects an unshifted logical value. The official FreeRTOS Kernel Book’s interrupt chapter explains the difference and notes that default priority zero must not be used for ISR-safe API calls on applicable ports. Configuration must be checked against the exact FreeRTOS version, processor port and project header.
Raising every interrupt to the highest priority does not solve latency. Doing so may defeat intended nesting, interfere with kernel critical sections, or make fault recovery less deterministic. Engineers should distinguish critical asynchronous fault handling, periodic control work, DMA completion, communications and routine logging. OSFEC.011 on synchronization and concurrency provides context for races and shared data.

Trace tools, timestamps and observer effects
SEGGER SystemView’s interrupt recording documentation describes entering and leaving interrupt trace hooks. Modern SystemView can correlate ISR activity, task switching and other events using target-generated timestamps; available features depend on the integration and license. Trace hooks add work, trace buffers can overflow, and the transport can lose records. A missing event can mean lost telemetry rather than an idle core.
Direct physical measurement and software tracing serve different purposes. An authorized test using an external signal generator and oscilloscope can capture the delay between a known input edge and a firmware-controlled output marker. An on-chip cycle counter or tracing framework can provide additional timing points, provided counter availability, rollover, frequency, synchronization and instrumentation overhead have been checked. No single technique is automatically ground truth across all targets.
Golioth, official developer tutorial covering Zephyr analysis with SEGGER J-Link, Ozone and SystemView. The walkthrough demonstrates a trace-based RTOS investigation on an embedded board. Original video.
The Zephyr zyclictest documentation offers a method to measure hardware interrupt response and thread wake-up delay, then record distributions. Its guidance also distinguishes test interval, clock resolution and histogram overflow. A large sample count can improve confidence about an observed maximum, but still does not mathematically prove an absolute worst case for all operating conditions.
A documented verification plan
- Define the timing requirement: state event source, allowed ISR-start latency, allowed thread-start latency, workload, clock configuration, operating mode, and environmental limits.
- Capture the exact firmware: record build hash, linker map, vector table, selected interrupt priorities,
__NVIC_PRIO_BITS, priority grouping and kernel interrupt-mask configuration. - Establish a measurement reference: identify input-edge detection, test pin or trace timestamp, instrument clock accuracy, trigger thresholds and probe-loading precautions.
- Exercise interference: run representative DMA, peripherals, control loops, communication bursts, interrupts, flash activity and low-power transitions without violating the product’s permitted service state.
- Quantify uncertainty: record mean, minimum, observed maximum, distribution tail, sample count, timer frequency, capture resolution, possible missed records and trace overhead.
- Diagnose anomalies: correlate latency spikes with critical sections, interrupt masks, nesting, bus access, flash stalls or scheduling delays instead of guessing from a single screen capture.
- Repeat and preserve evidence: save traces, measurement conditions, source versions and acceptance decisions. Escalate any limit violation and rerun under the same controlled conditions after approved changes.
Bench tests must use a suitable low-voltage development board and authorized probe connections. Never connect earth-referenced oscilloscope grounds to unknown or energized power nodes. Time-sensitive safety-critical changes require design review, applicable functional-safety requirements, and device-specific validation. The prior hardware-in-the-loop testing lesson explains controlled test rigs and fault injection.
Silicon Labs, official demonstration of SEGGER SystemView with Micrium µC/OS-III. The training shows how task and interrupt accounting support runtime analysis on another RTOS platform. Original video.
Failure patterns and limitations
A high average CPU utilization may correlate with long thread latency yet leave a truly high-priority, unmasked hardware interrupt responsive. Conversely, brief interrupt masking may cause a rare response spike on an otherwise lightly loaded system. A logging statement inside an ISR can distort timing or block on an unsafe facility. An ISR that performs lengthy application work can also delay lower-priority requests even when the hardware responded promptly to its own trigger.
For a field failure report, distinguish unobserved, observed but late, and observed on time yet functionally incorrect. The firmware observability lesson covers retention of timestamped evidence, while OSFEC.010 fault handling examines post-mortem state preservation.
Knowledge check
Question: On a common Cortex-M NVIC, is priority number 0 the weakest configurable interrupt priority? Answer: No. It is ordinarily the highest logical priority.
Question: Does a 3.6 µs ISR-start latency prove the application task runs after 3.6 µs? Answer: No. RTOS thread scheduling adds a separate response interval.
Question: If five measured samples have a 7.0 µs maximum, is 7.0 µs a guaranteed system-wide maximum? Answer: No. It is only the worst response observed in the small hypothetical sample.
References and technical documentation
- Arm CMSIS-Core NVIC reference, official interrupt priorities, exceptions and CMSIS APIs.
- Arm, Cutting Through the Confusion with Cortex-M Interrupt Priorities, priority numbering and shifted register encodings.
- FreeRTOS Kernel Book, Interrupt Management, official interrupt-safe RTOS APIs and priority rules.
- Zephyr Project, zyclictest, interrupt and thread latency estimation.
- SEGGER, Recording Interrupts, trace hooks, runtime observations and limitations.
- SEGGER SystemView User Guide, verified application features and recording analysis.
Elementary Conclusion
An interrupt is like a request for the chip to respond to something important. The time before the chip starts responding, the time spent handling the request, and the time until the application acts are separate measurements. A reliable engineer checks all three, assigns priorities carefully, and tests timing during realistic workloads instead of trusting a single quick reading.
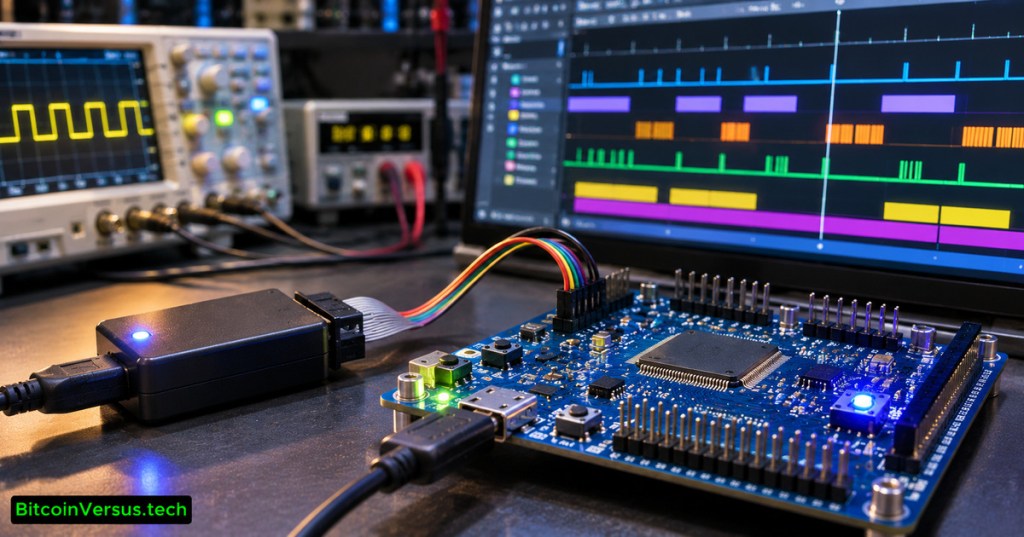
Editor’s Note: Primary Arm CMSIS, FreeRTOS, Zephyr and SEGGER documentation informed the descriptions and constraints. Every timestamp and cycle calculation is a clearly labeled teaching example, not a physical experiment. The 1200×630 photorealistic featured cover is original AI-generated editorial illustration with the BitcoinVersus.tech bottom-left watermark; the internal SystemView image is a credited genuine SEGGER screenshot. The three videos originate from SEGGER, Golioth and Silicon Labs respectively. Rendered embeds are not proof of playback, and neither hardware timing tests nor independent desktop/mobile browser screenshots were performed.

BitcoinVersus.Tech is volunteer-run and publishes independent technical education. Optional 5,000-satoshi contributions support research. Scan the QR from a second screen or import it into a compatible wallet. Independently confirm receiving address 3C9o19EH5HSiwEPyCTmEKzxhNCbo2X6TTb and amount. Bitcoin transactions are generally irreversible.
We volunteer daily to ensure the information on BitcoinVersus.Tech is Verifiably True. Educational content does not authorize unsafe electrical work or replace equipment-specific verification by qualified personnel.


Leave a Reply