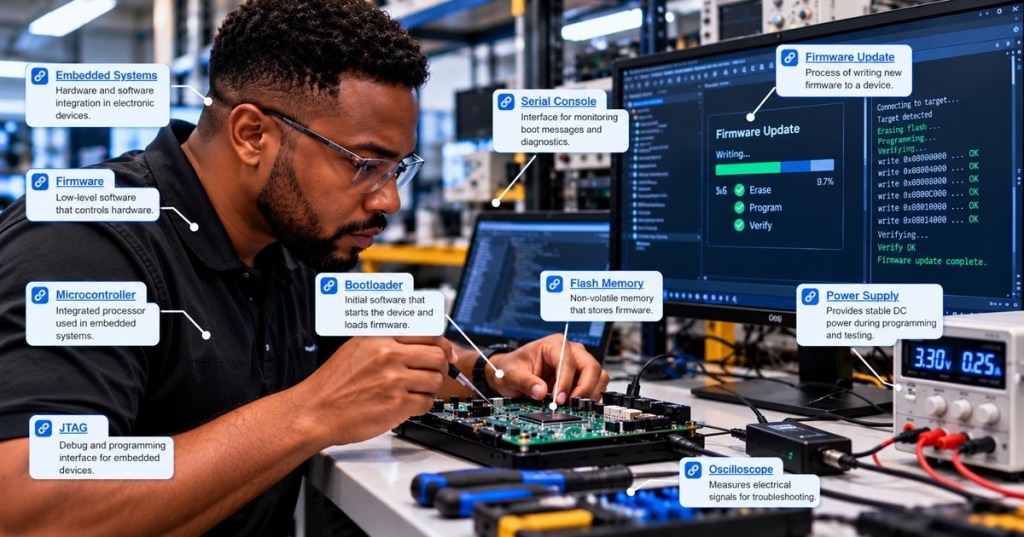
Firmware observability is the engineering practice of designing an embedded system so its internal state and behavior can be understood from measured outputs. Unlike a desktop application, a microcontroller-based device may have little storage, limited bandwidth and strict timing deadlines. Its diagnostic design must reveal failures without causing them. This is OSFEC.012, the next Firmware Engineering lesson after OSFEC.011 on RTOS synchronization and concurrency.
The purpose of embedded observability
Observability is broader than printing debug messages. A useful system exposes enough information to distinguish a transient communication fault, a missed deadline, a watchdog reset, a sensor failure and a corrupted configuration. The evidence may come from counters, timestamps, structured event logs, performance measurements, health indicators or a preserved fault snapshot.
For example, a motor controller that occasionally restarts should report not only that a reboot occurred but also its reset-cause register, prior firmware version, uptime, supply-voltage status and recent critical faults when those values can be obtained safely. A post-mortem architecture preserves the evidence; observability determines what evidence is collected and how it can be interpreted.
Diagnostic channels and instrumentation
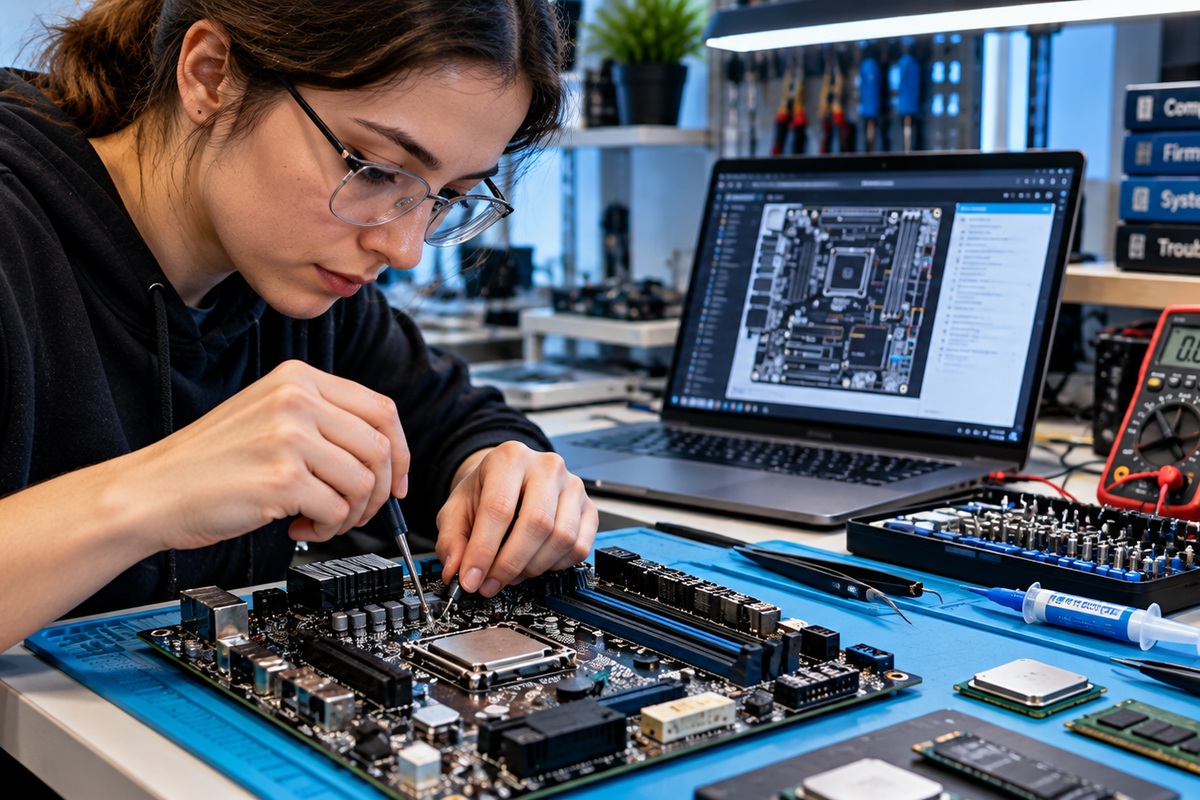
Common channels include a UART serial console, SWD/JTAG debug probes, a peripheral bus, network telemetry or nonvolatile event records. An SPI-connected flash device may store fault history, while a logic analyzer or oscilloscope can measure external electrical timing when software logs are insufficient.
The following previously published lab photograph illustrates a hardware-debugging environment where serial, bus and probe observations can be compared. It is contextual editorial media, not a capture from a specific device.
Designing structured event records
Free-form messages such as error happened are difficult to correlate. A structured record can include an event ID, firmware build identifier, monotonic timestamp, severity, component ID and bounded diagnostic fields. For example, EVT_I2C_TIMEOUT, t=842193ms, bus=1, addr=0x48, attempts=3 gives the engineer a reproducible starting point. A monotonically increasing clock is often preferable for event ordering; wall-clock time can be added if it is available and trustworthy.
Event IDs should remain stable across firmware revisions, and log formats should be versioned. Sensitive data such as credentials, private keys and personal information must never be written to diagnostics merely because a buffer is available. Security-sensitive systems should also protect log integrity and access.
Timing and resource constraints
Every diagnostic operation consumes resources. A blocking print call inside an interrupt service routine may extend interrupt latency and cause a missed real-time deadline. A practical architecture records a compact event in a bounded buffer and transfers it later from a lower-priority task. The buffer requires an explicit overflow policy: drop oldest, drop newest or increment a loss counter, according to the application’s risk and evidence requirements.
Engineers must evaluate task scheduling, DMA transfers, queue contention and concurrency when implementing telemetry. The diagnostic system must not silently alter the behavior it is meant to measure.
Worked example: sizing a diagnostic link
Suppose a device emits 50 event records per second, each containing 48 bytes after serialization. Its average payload rate is 50 × 48 = 2,400 bytes/s. A conventional asynchronous UART configured for 8 data bits, no parity and one stop bit typically transmits 10 line bits per byte, including start and stop bits. The resulting average serial rate is approximately 24,000 bits/s before any extra protocol overhead.
A 115,200-bit/s UART has enough nominal capacity for this average workload, but that fact alone does not establish worst-case safety. A burst of 300 records would create 14,400 bytes of queued payload. At 115,200 bits/s with ten bits per byte, transmitting that burst would take at least 1.25 seconds if the channel were otherwise idle. The design needs sufficient buffering, rate limits and a documented overflow policy.
Health counters and fault snapshots
Counters can summarize recurring conditions without flooding the link: bus timeouts, failed sensor reads, missed scheduling deadlines, queue overruns and unexpected resets. A fault snapshot may preserve selected register values, the active task, stack bounds, firmware build ID and reset cause. See OSFTC.010 on crash logs and recovery for technician-level interpretation and OSFEC.010 for fault-handling design.
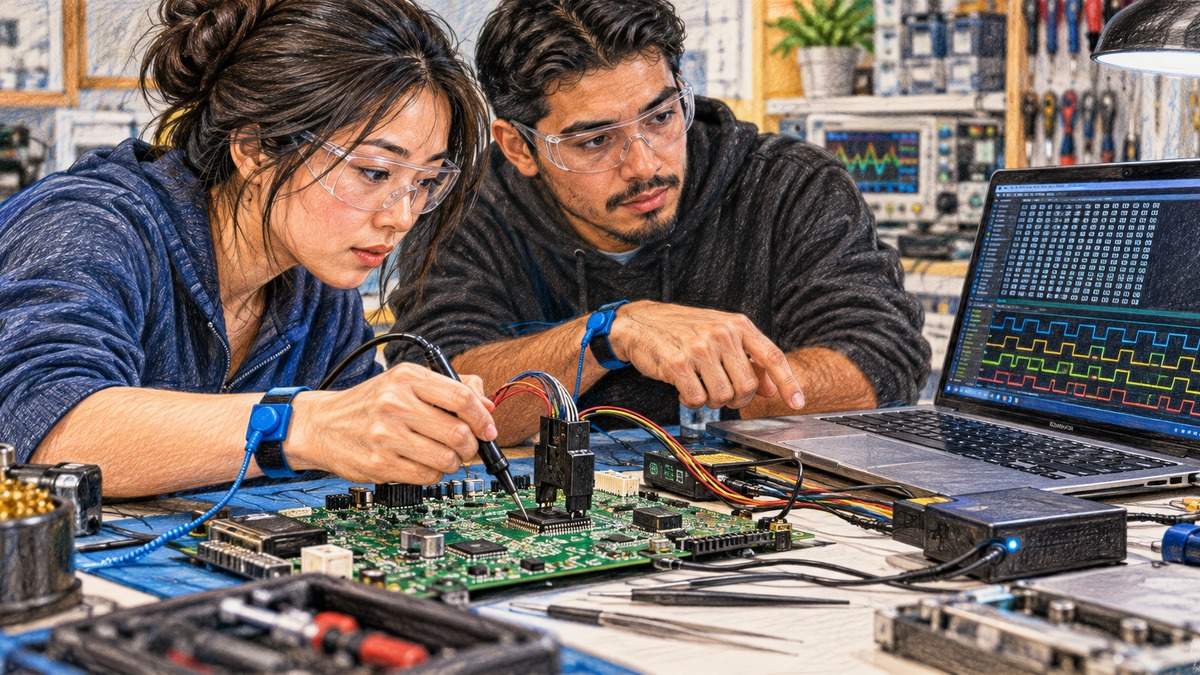
The next existing photograph shows an SPI flash troubleshooting bench. It provides physical context for the nonvolatile storage that some embedded designs use to retain diagnostic records across a power cycle.
Validation and field deployment
Observability must be tested under normal operation, high event rates, low memory, reset conditions and disconnected host links. Engineers should measure the logging path’s worst-case execution time and verify that it does not violate application deadlines. Validate that event IDs map to documentation, counters survive only as intended, and recovery behavior remains deterministic when storage is full.
In safety-related products, diagnostics support investigation but do not replace independent protection, formal hazard analysis or required safety functions. For secure update and release provenance, consult OSFTC.013 on firmware image integrity and OSFTC.011 on firmware update security.
Knowledge check
- Why can a blocking UART print inside an interrupt handler cause a new system failure?
- What is the average line rate for 50 records/s at 48 bytes per record using 8N1 framing?
- Why should a bounded diagnostic queue report dropped records?
Answers: It can increase interrupt latency and delay time-critical work; approximately 24,000 bits/s before additional overhead; otherwise an engineer might mistake missing evidence for an absence of faults.
References and further reading
For engineering references, consult the FreeRTOS queue management documentation, Zephyr’s logging subsystem documentation and NIST’s platform firmware resiliency guidance. These resources cover bounded inter-task messaging, logging design and resilient firmware practices.
BitcoinVersus.Tech Editor’s Note: Support independent firmware engineering education with a donation of 5,000 sats. Scan the QR code below with a compatible Bitcoin wallet to contribute.

Open the QR code on another screen and scan it with your Bitcoin wallet.


Leave a Reply