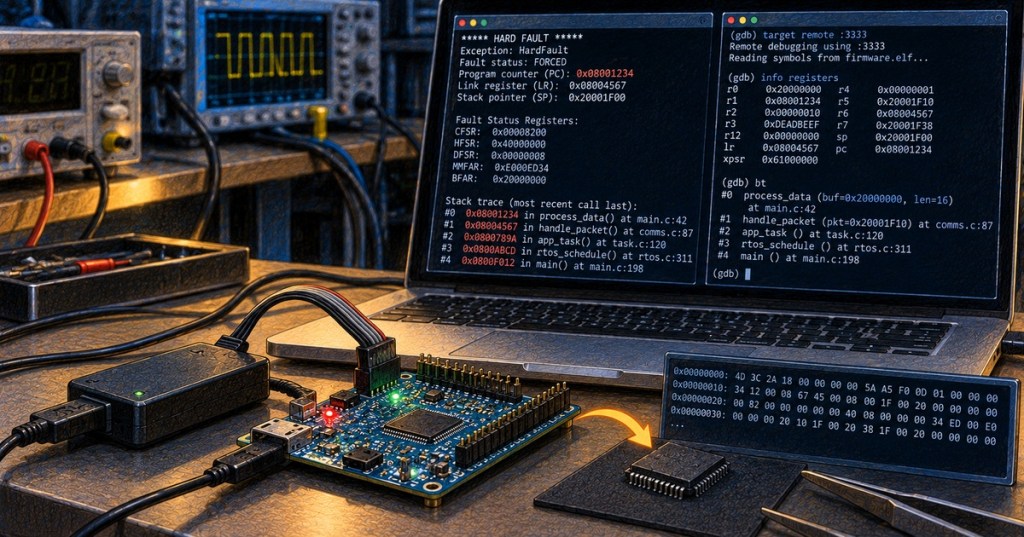
A firmware crash is not just an outage; it is a snapshot of what the processor was doing when execution failed. A technician who preserves the reset cause, fault registers, program counter, link register, stack data, build identity, and serial log can often turn an intermittent failure into evidence an engineer can reproduce and fix.
This lesson follows OSFTC.009: CAN Bus Troubleshooting. Earlier lessons covered watchdog timers and reset loops, firmware backup and recovery, and serial console and boot logs. OSFTC.010 combines those skills into a structured crash-recovery workflow.
Memfault demonstrates practical Cortex-M HardFault analysis, including stacked registers, fault-status registers, stack traces, GDB, and automated crash collection.
Elementary Overview
When firmware crashes, the processor often still has useful clues. Think of those clues like marks left at an accident scene: which instruction was running, where the program expected to return, what kind of memory error occurred, and what task was active. The technician’s first job is to protect those clues before resetting, reflashing, or changing the hardware.
Learning Objectives
- Distinguish reset logs, fault-register dumps, stack traces, and core dumps.
- Identify the minimum evidence to capture before recovery.
- Interpret the technician meaning of PC, LR, SP, fault-status registers, and reset-cause registers.
- Use an ELF file and address-to-line tools to map crash addresses back to source code.
- Explain why build identity must match the crashed firmware exactly.
- Use GDB and stored core dumps for post-mortem inspection.
- Recognize when reflashing destroys evidence.
- Separate safe technician recovery from engineering-level root-cause changes.
Start With the Reset Cause
Before assuming a software bug, determine why the processor restarted. Depending on the MCU, reset-cause registers may distinguish power-on reset, brownout, watchdog reset, software reset, pin reset, lockup, or other platform-specific events. Record the raw register value and the decoded cause before firmware clears it during boot.
A watchdog reset and a HardFault can describe different failure paths. A HardFault means the CPU entered an exception because execution violated an architectural rule or escalated another fault. A watchdog reset usually means software stopped servicing the watchdog for too long. The final symptom may be the same—a reboot—but the evidence and troubleshooting direction are different.
Capture Evidence Before Recovery
- Record device serial number, board revision, and power conditions.
- Record exact firmware version, build ID, commit, image hash, and bootloader version.
- Capture the complete serial/UART log without trimming the beginning.
- Record reset-cause registers before they are cleared.
- Capture PC, LR, SP, xPSR, and general-purpose registers if available.
- Capture architecture fault registers such as CFSR, HFSR, MMFAR, and BFAR on Cortex-M systems when implemented.
- Save the stack trace or backtrace exactly as printed.
- Export any core dump before erasing, reflashing, or factory-resetting the device.
- Record the test action immediately preceding failure.
- Photograph or save instrument conditions if voltage, current, temperature, or signal integrity may be relevant.
Linaro demonstrates essential Cortex-M debugging with GDB, including register inspection and practical firmware-debug workflows.
PC, LR, and SP Are the First Coordinates
The program counter (PC) identifies the instruction address associated with execution at the captured point. The link register (LR) normally carries return or exception-return information. The stack pointer (SP) identifies the active stack location. On Cortex-M exceptions, hardware automatically saves an exception frame containing registers such as R0-R3, R12, LR, PC, and xPSR. That saved PC is often the fastest path from a raw crash log to the failing source location.
Do not assume every PC value is the true root cause. Stack corruption, a damaged function pointer, buffer overrun, invalid exception return, or earlier memory corruption can make the processor fail far away from the original bug. Treat the faulting instruction as the starting point for diagnosis, not automatic proof of cause.
Fault Registers Explain the Type of Failure
On Arm Cortex-M devices, the configurable fault-status registers can identify classes such as memory-management faults, bus faults, and usage faults. Address registers may also preserve the memory address involved in a valid fault. Common technician-visible patterns include invalid reads or writes, unaligned accesses on platforms that fault on them, divide-by-zero when trapping is enabled, undefined instructions, corrupted return addresses, and execution through bad function pointers.
The technician should preserve the hexadecimal register values even when a debugger already prints a human-readable explanation. Decoder software, vendor tools, and engineering scripts change over time; the original values remain the most durable evidence.
Map Addresses With the Exact ELF File
A raw address becomes much more useful when matched against the exact executable-and-linkable-format file produced by the same build. The ELF file contains symbols and address information that a stripped production binary normally does not. If the ELF comes from a different build, even one with the same visible version number, addresses may resolve to the wrong function or source line.
arm-none-eabi-addr2line -e firmware.elf -f -C 0x08001234

arm-none-eabi-gdb firmware.elf
(gdb) info registers
(gdb) bt
(gdb) x/16wx $sp
(gdb) list *0x08001234
These commands are examples, not universal syntax for every architecture. The principle is universal: preserve the exact firmware symbols, then translate captured addresses using tools built for that target.
Core Dumps Preserve More Than a Log
A core dump stores structured processor and memory state for post-mortem analysis. Zephyr’s core-dump subsystem can save CPU registers and selected memory through logging, UDP, flash, or other supported backends. Espressif’s ESP-IDF can save task control blocks and stacks so the crash can later be decoded with development tools. The exact contents vary, but the goal is the same: preserve enough state to inspect the failed system after the device has stopped normal execution.
The Linux Foundation and Memfault show how Zephyr core dumps preserve fault state and can be analyzed later with GDB.
A crash dump can contain sensitive information because RAM may include credentials, keys, customer data, network tokens, or proprietary state. Store and transfer dumps under the same security controls used for other diagnostic artifacts, and never publish a raw production dump casually.
Logs and Core Dumps Serve Different Purposes
- Boot log: shows startup sequence and reset reason.
- Application log: shows events the firmware intentionally reported before failure.
- Fault register dump: describes CPU exception state.
- Stack trace: reconstructs likely call history.
- Core dump: preserves structured registers and memory for offline analysis.
- Oscilloscope or logic-analyzer capture: adds physical evidence when a crash correlates with power, reset, clock, or bus activity.
Do not substitute one artifact for all the others. A log may show the last successful event but not the exact exception state. A core dump may preserve memory but lack the external voltage transient that caused the failure. Strong troubleshooting correlates software evidence with hardware conditions.
Reproduce Without Destroying the Original Evidence
After evidence is secured, reproduce the failure on a controlled unit whenever possible. Match firmware build, board revision, peripherals, input data, power supply, temperature, communications traffic, and timing. Change one variable at a time. If the failure is intermittent, preserve timestamps so repeated crashes can be correlated with external events.
This embedded-debugging talk demonstrates Cortex-M GDB workflows, debug probes, coredumps, tracing, and non-invasive techniques useful when a crash depends on timing.
When to Reflash
Reflashing is a recovery action, not automatically a diagnostic action. Reflash after evidence has been captured, when the authorized repair procedure calls for it, when image integrity is known to be bad, or when a controlled A/B comparison requires a known-good image. Do not reflash first simply because a device crashed; doing so may erase the only copy of the failure evidence.
If a known-good image immediately crashes in the same way, expand the fault domain to hardware, power integrity, RAM/flash health, peripheral state, board revision, configuration storage, and environmental conditions. Firmware technicians should avoid repeatedly cycling images without recording what each attempt proves.
An embedded-systems discussion illustrates common real-world workflows: preserve the stacked PC, decode fault registers, capture exception frames, and use symbol files rather than relying on a generic “HardFault” message.
Technician Escalation Package
- Device and board identifiers.
- Exact firmware image hash and matching ELF/map files.
- Bootloader and configuration versions.
- Complete serial log.
- Reset cause.
- PC, LR, SP, xPSR, and fault-status registers.
- Stack trace or decoded source location.
- Core dump if available.
- Exact reproduction steps and occurrence rate.
- Power, temperature, communications, and peripheral conditions.
- What recovery actions were attempted and their results.
This package lets engineering reproduce the state instead of starting from “the device rebooted.” Good technician evidence shortens root-cause time and also prevents unnecessary board swaps, reflashes, and firmware changes.
Hands-On Exercise
A device reboots after processing a specific packet. The console shows a HardFault, PC = 0x08001234, LR = 0x08004567, BFAR = 0x20000000, and a valid bus-fault address flag. The production binary is available, along with three ELF files from different builds.
- Explain which ELF file must be selected and how to prove it matches the crashed image.
- List the evidence that must be copied before resetting or reflashing.
- Use the example
addr2linecommand to resolve PC 0x08001234. - Explain why BFAR = 0x20000000 is useful but does not by itself prove which source-code statement caused the bad access.
- Describe one controlled reproduction test and one hardware measurement that could strengthen the diagnosis.
Knowledge Check
- Why should crash evidence be captured before reflashing?
- What does the program counter identify?
- Why must the ELF file match the exact firmware build?
- What is the difference between a watchdog reset and a HardFault?
- What additional information can a core dump preserve beyond a text log?
- Why should raw hexadecimal fault-register values be saved?
- What does
addr2linehelp determine? - Why can the faulting PC be a symptom rather than the original cause?
- Name three environmental or hardware conditions worth recording during reproduction.
- When should a technician escalate instead of changing firmware behavior?
Answers
- Reflashing may erase logs, retained RAM, stored core dumps, or other evidence needed to diagnose the original failure.
- The instruction address associated with execution at the captured point.
- Addresses and symbols change between builds, so a mismatched ELF can map the same address to the wrong function or line.
- A watchdog reset occurs after the watchdog is not serviced within its allowed interval; a HardFault is an architectural exception or escalated fault condition.
- CPU registers, task state, stacks, and selected memory regions, depending on the platform and configuration.
- The original register values can be re-decoded later even if tools or interpretation change.
- It maps a code address against symbols in the matching ELF to a function and, when debug information exists, a source file and line.
- Earlier memory corruption, stack corruption, or a bad function pointer may only become visible when execution finally reaches the faulting instruction.
- Examples include supply voltage, current, temperature, clock/reset behavior, bus traffic, and peripheral state.
- When evidence is collected and the next step would change code, recipes, protected configuration, or safety-critical behavior beyond the approved technician procedure.
Elementary Conclusion
The most important rule is simple: do not erase the clues. A crash address, fault register, exact build file, serial log, and core dump can explain a failure that would otherwise look random. Recover the device only after the evidence is safe, then reproduce methodically and escalate with a complete diagnostic package.
Primary References
- Zephyr Project — Core Dump
- Espressif ESP-IDF — Fatal Errors
- Espressif ESP-IDF — Core Dump
- Arm — Cortex-M4 Devices Generic User Guide
BitcoinVersus.Tech Editor’s Note:
We volunteer daily to ensure the credibility of the information on this platform is Verifiably True. If you would like to support to help further secure the integrity of our research initiatives, please donate using the QR code provided

For best QR-code scanning results, please scan this donation code from a desktop or larger screen. Mobile screens may prevent camera recognition.
BitcoinVersus.Tech provides technical education and analysis for informational purposes only.


Leave a Reply