
Elementary Overview
OSITC.014 explains how to distinguish insufficient physical RAM from an exhausted memory commitment limit or ordinary cache activity. Slow Windows applications do not automatically mean defective memory modules. A technician should correlate symptoms with measurements before changing system settings.
The lesson follows OSITC.013 on disk latency, OSITC.012 on Performance Monitor and OSITC.011 on Resource Monitor. Learning goals include identifying committed memory, working sets, hard faults, standby cache and safe pagefile triage.
Independent Windows Performance and Monitoring: Resource Monitor Tutorial. The walkthrough illustrates the interface; Microsoft’s documentation remains authoritative for counter definitions Watch the original video.
Read the memory numbers separately
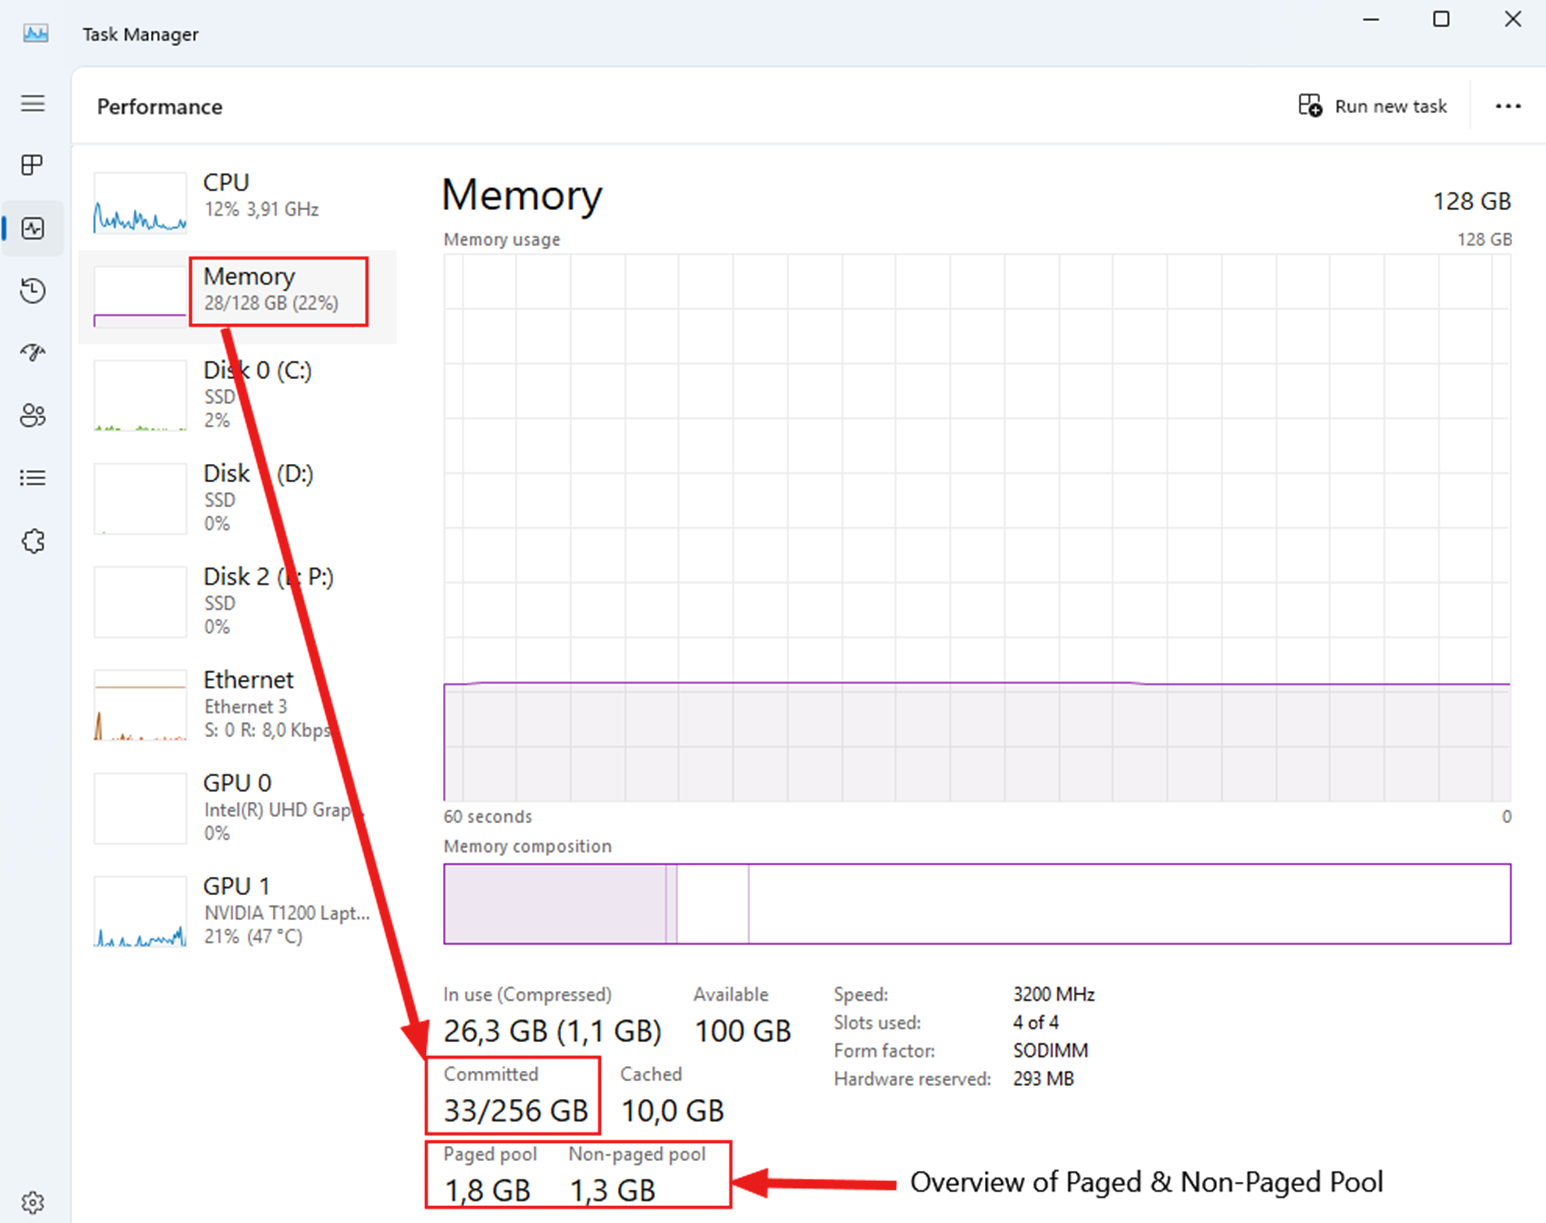
In use describes RAM currently occupied. Available includes memory Windows can provide for new work, including reclaimable standby pages. Committed tracks memory backed by RAM or paging files under Windows’ commitment accounting; it does not mean that the entire displayed amount was written to disk. The commit limit is influenced by installed RAM and paging-file capacity, with system overhead.
Hard faults do not mean faulty RAM
A hard page fault means Windows had to obtain a requested page from storage rather than an already resident physical page. Some hard faults retrieve file-backed content, not necessarily pagefile data. The count is not an error tally for DRAM hardware. Sustained hard faults alongside poor available RAM, elevated disk response time and a slow application are more informative than an isolated spike.
A process working set is its resident physical-memory allocation, whereas private committed bytes describe a different accounting quantity. Kernel paged and nonpaged pools need separate attention. A rising nonpaged pool may warrant driver investigation, not simply closing the largest visible application.
A safe, repeatable diagnostic workflow
- Open Task Manager, Performance, Memory. Note installed RAM, available memory, committed amount and the observation time.
- Open Resource Monitor, Memory. Correlate processes, working sets and hard faults with the reported slowdown.
- Record
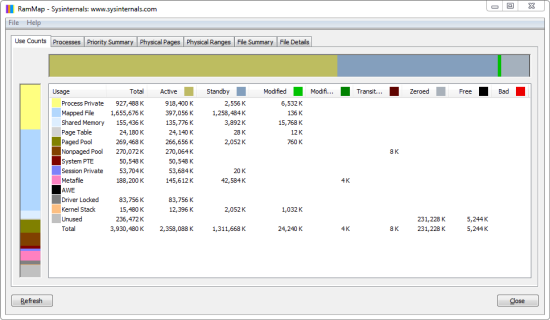
\Memory\Available MBytes,\Memory\% Committed Bytes In Useand relevant disk counters using Performance Monitor, with a matching baseline. - Inspect the Microsoft Sysinternals RAMMap Use Counts and Priority Summary tabs without clearing memory lists.
- Check application and system error history using OSITC.010 Reliability Monitor; document findings before escalation.
Worked calculation and pagefile caution
Assume a hypothetical workstation reports 20 GiB committed against a 28 GiB commit limit. Utilization equals 20 ÷ 28 × 100 ≈ 71.4%; remaining commitment headroom is 8 GiB. The arithmetic says nothing by itself about disk paging or a required RAM upgrade.
Microsoft explains that pagefile sizing depends on workload commitment, crash-dump needs and system configuration. There is no universal requirement to set the pagefile to 1.5 times installed RAM. Preserve the system-managed configuration unless authorized diagnosis supports a change. Disabling the pagefile can reduce commit headroom and interfere with crash-dump collection.
Elementary Conclusion
Diagnose memory pressure by comparing available RAM, commit headroom, hard faults, process behavior and storage latency at the same time. Use the storage fundamentals lesson when a paging-related slowdown points toward the storage path. Avoid clearing caches or altering virtual-memory settings solely to make one graph look better.
References: Microsoft pagefile sizing; memory performance terminology; hard-fault definitions; Microsoft’s original RAMMap training video.
Editor’s Note: Microsoft documentation supplies technical definitions. The featured cover is original AI-generated editorial illustration, including fictional screen data. Both in-body screenshots are genuine Microsoft educational images. The numerical example is hypothetical. No Windows workstation was physically tested; server-side player rendering is not independent playback or mobile-viewport verification.

BitcoinVersus.Tech is volunteer-run. An optional 5,000-satoshi contribution supports educational research. Confirm receiving address 3C9o19EH5HSiwEPyCTmEKzxhNCbo2X6TTb and the amount in your wallet; Bitcoin payments are generally irreversible.
We volunteer daily to ensure the information on BitcoinVersus.Tech is Verifiably True. Educational material does not replace site-specific change-control procedures.


Leave a Reply