
OSITC.013 teaches evidence-based diagnosis of slow storage in Windows using latency, input/output operations per second (IOPS), throughput, and outstanding I/O. A disk that appears highly active is not automatically defective. High utilization can be caused by legitimate workload, limited device capability, insufficient memory, an overloaded storage path, controller problems, or intermittent I/O errors. The technician’s task is to identify which measurements support a specific explanation rather than change configuration based on one graph.
The required starting points are OSITC.012: Windows Performance Monitor, which introduced counters and baselines, and OSITC.011: Windows Resource Monitor, which identified active storage consumers. The current lesson applies those tools to disk-service time, operation rate, and queue behavior; it does not repeat the general monitoring introduction.
Learning Objectives and Prerequisites
- Explain the difference between latency (time per completed I/O), IOPS (I/O operations per second), throughput (bytes per second), and outstanding requests (in flight or waiting).
- Interpret Windows
PhysicalDiskandLogicalDiskcounters without confusing seconds with milliseconds or IOPS with bytes per second. - Compare baseline, workload, process, and event-log evidence to isolate a storage bottleneck.
- Collect a limited series of read-only performance samples using supported Windows tools.
- Complete unit conversions and a steady-state outstanding-I/O estimate using clearly stated assumptions.
- Document a safe next step that preserves important data and avoids uncontrolled benchmarks.
Prerequisites: basic Windows navigation, introductory PowerShell, familiarity with the OSITC.002 storage and file-systems lesson, and elementary division. Equipment: Windows 10/11 or a supported Windows Server installation that includes Performance Monitor and PowerShell, a standard user account for read-only inspection where permissions allow, and a notebook. Counter names may be localized, and certain diagnostic features require elevated privileges. No storage hardware should be opened or modified.
Storage Hardware Changes the Baseline
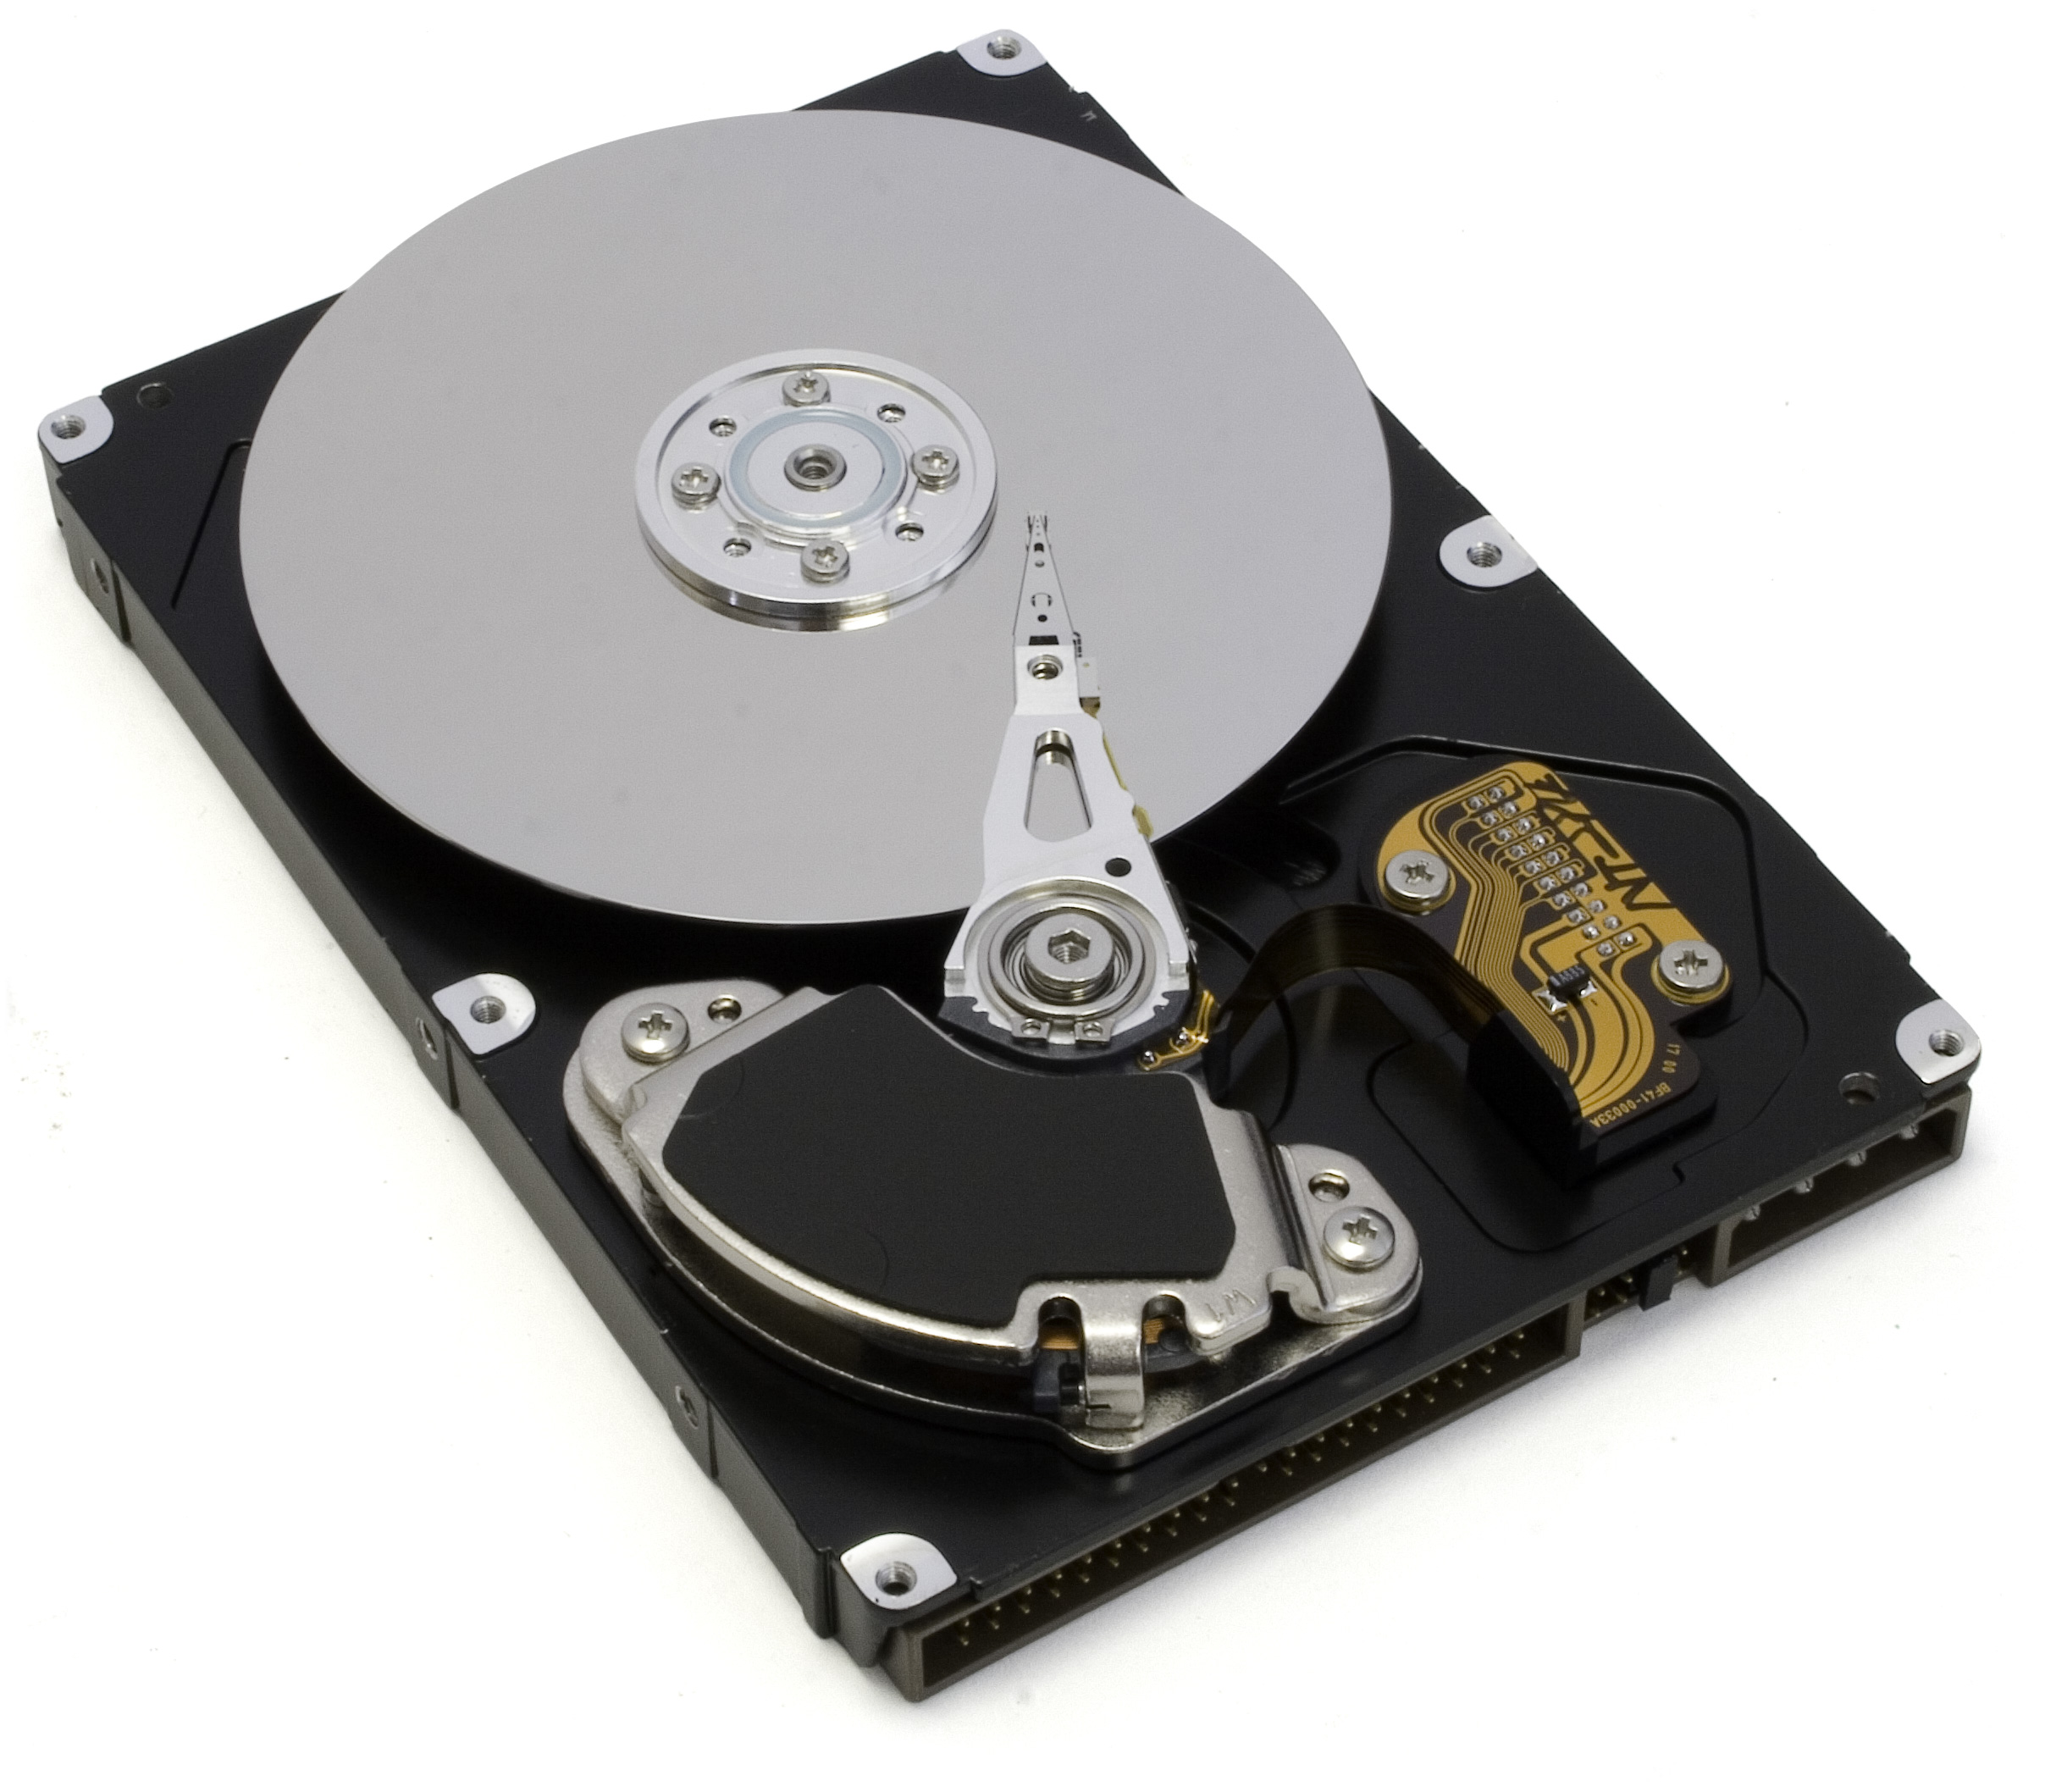
A conventional hard disk drive (HDD) uses spinning platters, a moving actuator, and magnetic heads. Its response time includes mechanical seek and rotational delays in addition to transfer time. A solid-state drive (SSD) stores data in semiconductor memory and has no spinning media. Both can experience contention and software delays; neither has one universal healthy latency value.
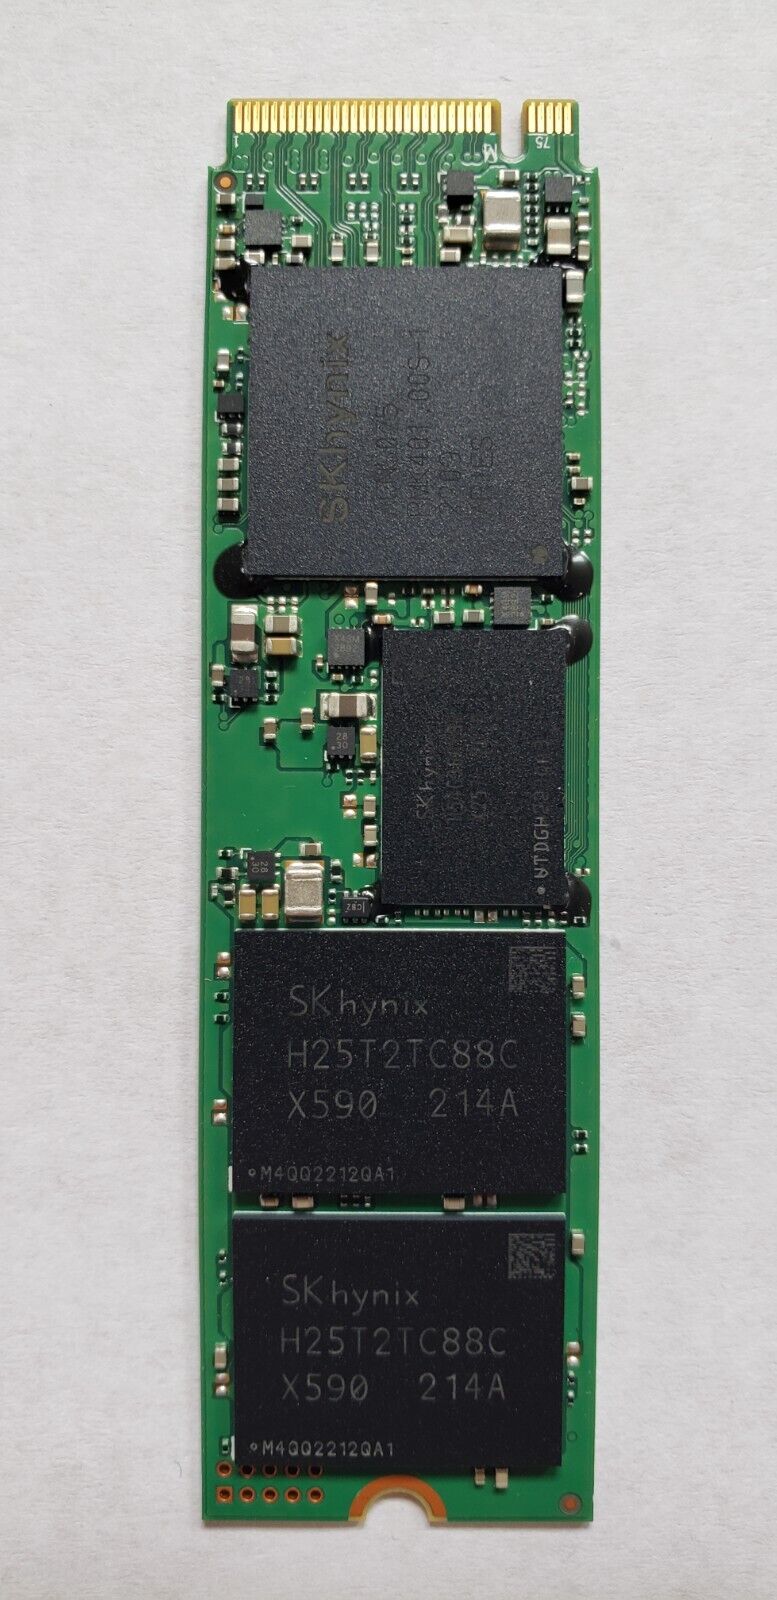
An M.2 NVMe SSD communicates through a PCI Express interface and its performance depends on controller firmware, NAND characteristics, PCIe link, temperature, queue depth, request pattern, and other conditions. Its nameplate sequential transfer rate should not be used as a prediction of random 4 KiB response latency. The difference between a device’s advertised maximum and a time-stamped workstation measurement is a central diagnostic distinction.
The Four Measures a Technician Must Separate
- Latency: average time per reported disk read or write. Windows
Avg. Disk sec/ReadandAvg. Disk sec/Writereport seconds; multiply by 1,000 for milliseconds. Sample 0.012 seconds = 12 milliseconds. - IOPS: completed read or write operations per second; related counters include
Disk Reads/sec,Disk Writes/sec, andDisk Transfers/sec. IOPS alone does not specify bytes per operation. - Throughput: bytes transferred per second, such as
Disk Read Bytes/secorDisk Bytes/sec. Small random requests and large sequential requests can show similar IOPS but different throughput. - Outstanding work: I/O requests waiting and/or in service.
Current Disk Queue Lengthis a point-in-time counter, while average queue-length counters are time-averaged. These are not direct counts of defective sectors or the number of human users.
Microsoft documents disk latency and transfer counters in its drive performance-history reference and the Windows Server troubleshooting guide. The latter provides general latency bands for investigating persistent problems. Those bands are useful starting points, not universal hardware service-level agreements, particularly for NVMe, virtual disks, storage arrays, or mixed workloads. A one-second spike is less persuasive than a prolonged deviation from a comparable baseline.
Three Windows Views and Their Limits
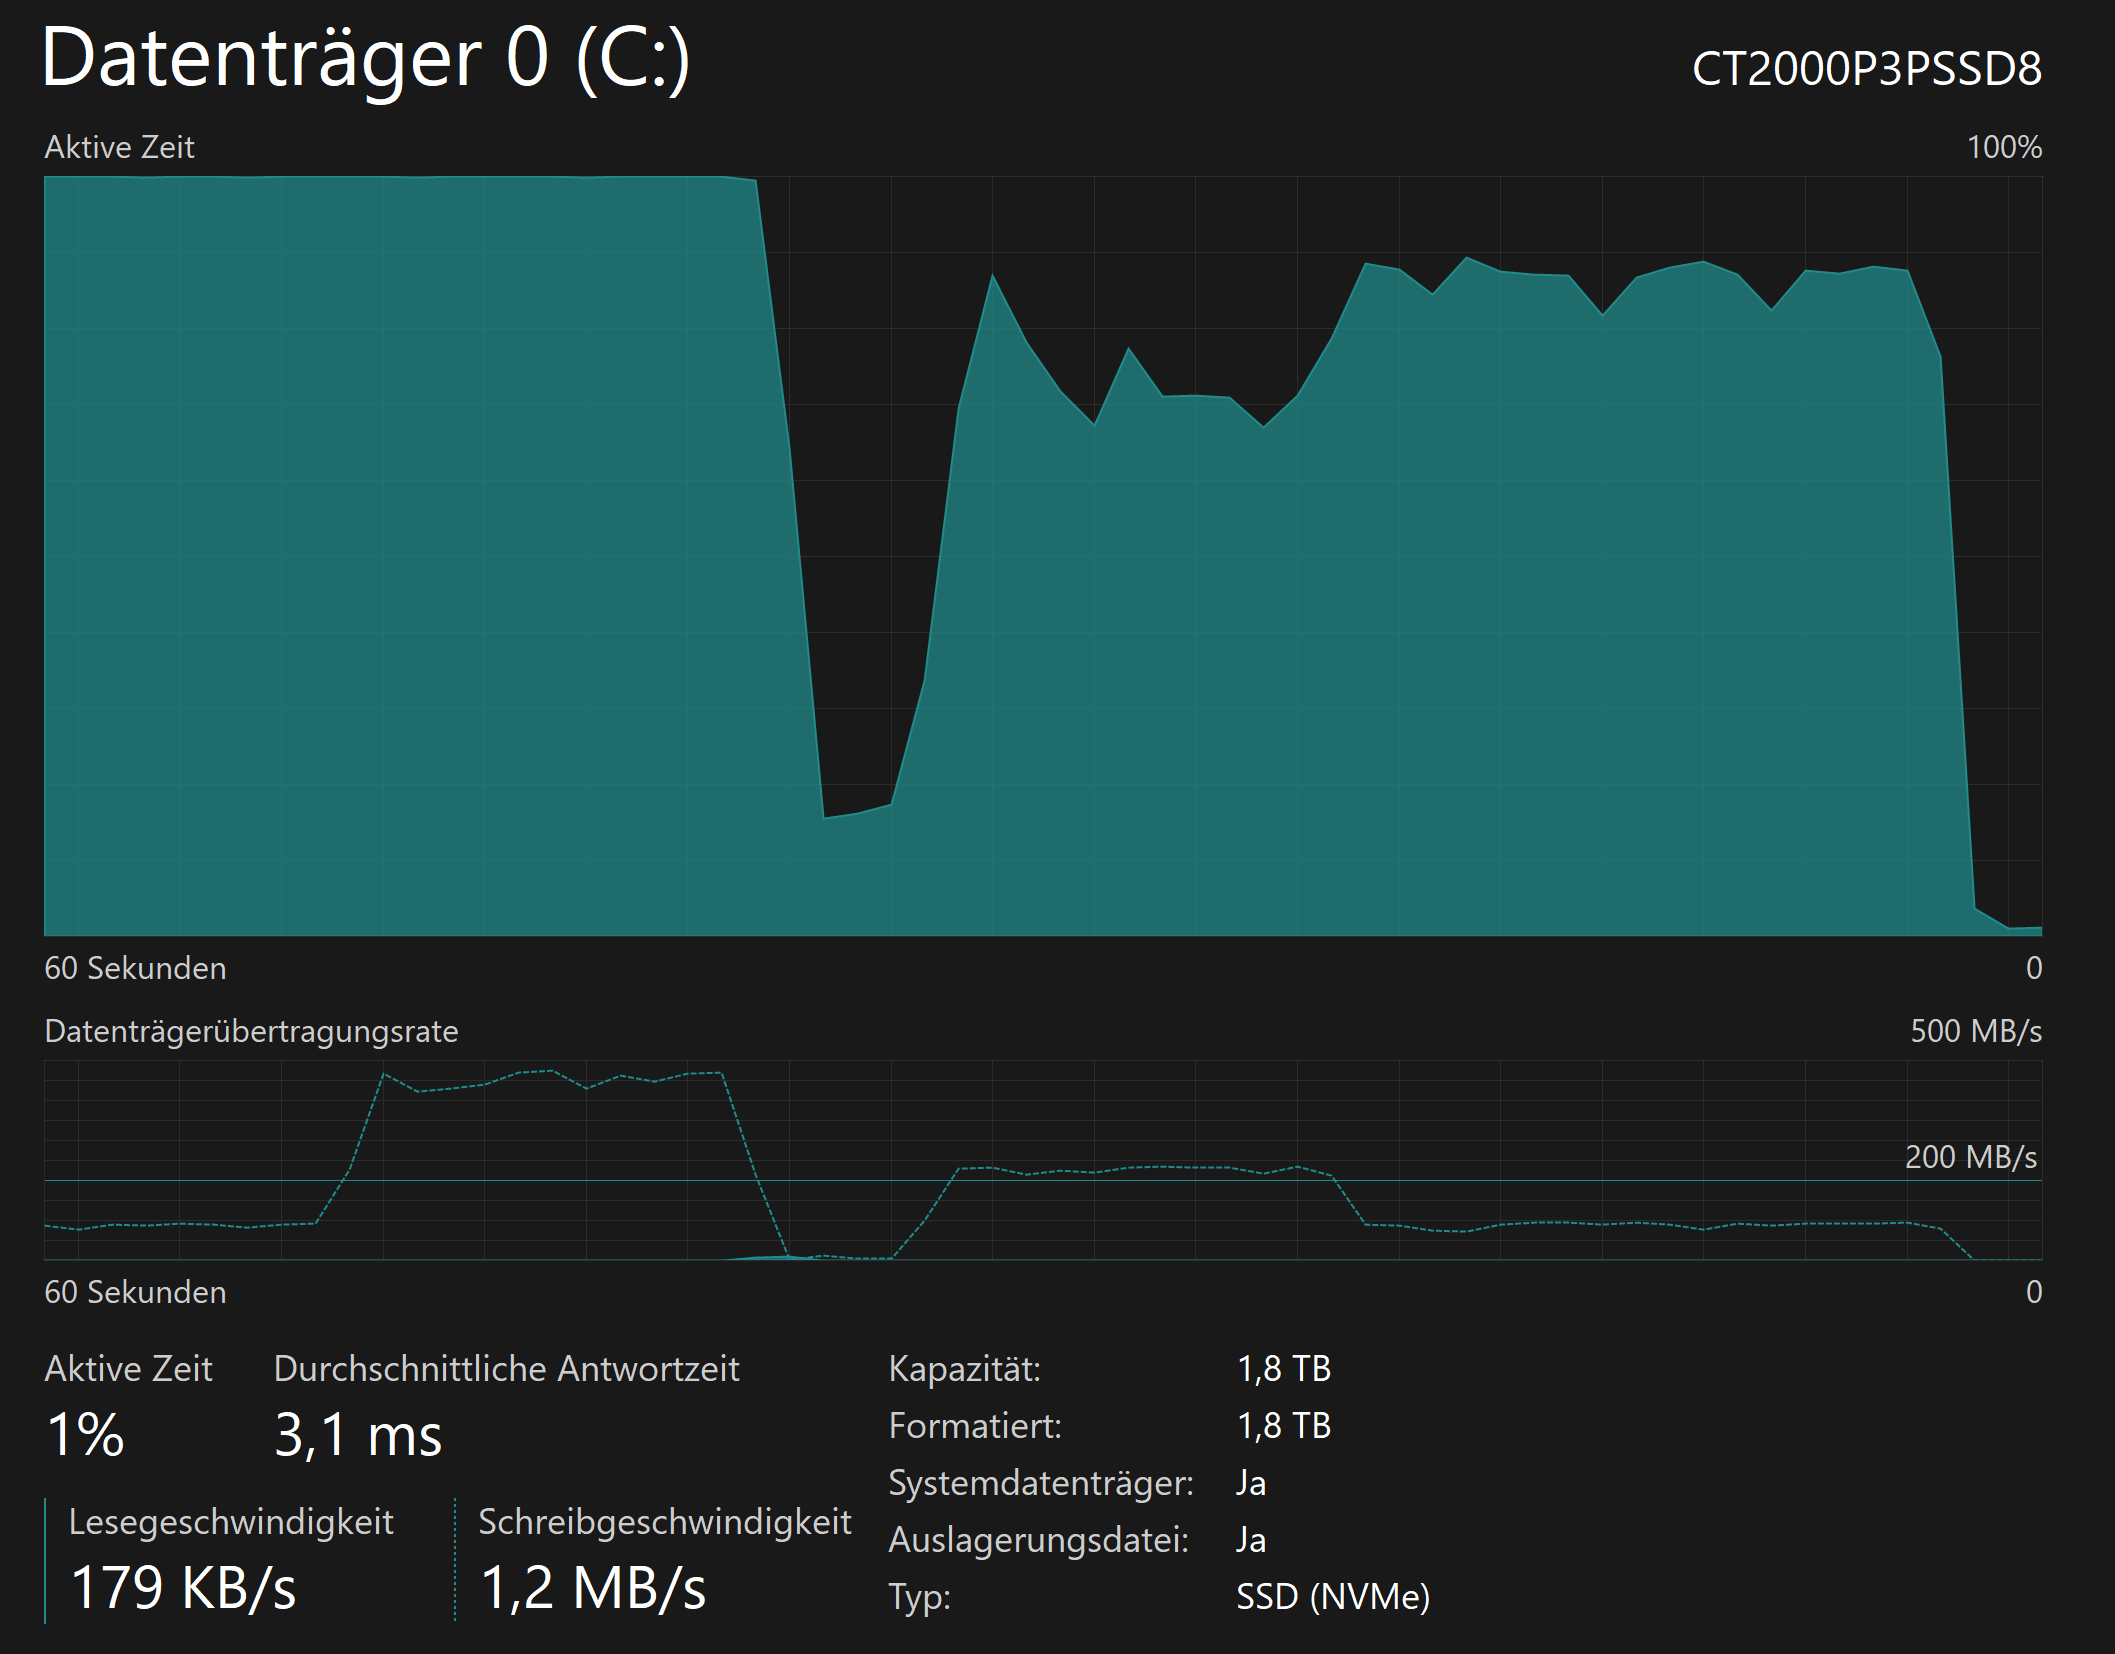
Task Manager offers a quick storage activity and throughput view. Open it with Ctrl+Shift+Esc, then select Performance and the relevant disk. Disk identity and available readings vary with Windows release, device type, and driver support. The sample below was captured by its creator after a benchmark; it is not the output of a test performed for OSITC.013.
Resource Monitor (resmon.exe) provides a process-oriented view of current disk activity and file paths; use it to ask which process is generating the work? Performance Monitor (perfmon.exe) supports precise counter selection, interval sampling, and historical evidence. To distinguish logical volumes from physical storage, inspect both LogicalDisk and PhysicalDisk counters, and document the mapping. A virtual machine, hardware RAID controller, or storage array can obscure physical-drive details.
Read-Only PowerShell Sampling
The Microsoft Get-Counter reference describes sampling Windows performance counter instrumentation. The commands below are designed for a Windows PowerShell session and require no third-party module. They were checked against the documented command signatures but were not executed on a live Windows host in preparation for this article. Use the locally displayed counter names where system-language localization differs.
First list the installed disk counter paths and available instances:
(Get-Counter -ListSet PhysicalDisk).PathsWithInstances
Next, run the following bounded three-sample read-only diagnostic. The _Total instance aggregates storage activity and can conceal a problem affecting just one disk; select individual paths for targeted analysis.
$path = '\PhysicalDisk(_Total)\Avg. Disk sec/Read'
Get-Counter -Counter $path -SampleInterval 2 -MaxSamples 3 |
  ForEach-Object {
    [pscustomobject]@{
      Time = $_.Timestamp
      ReadLatencyMs = [math]::Round(
        $_.CounterSamples[0].CookedValue * 1000, 2)
    }
  }
The output should contain a timestamp and a numerical ReadLatencyMs value per successful sample, for example the hypothetical rows 10:00:02 — 4.2 ms, 10:00:04 — 14.8 ms, and 10:00:06 — 6.1 ms. Those numbers are illustrative, not measured or promised output. The command can fail if a counter path is absent, translated, inaccessible, or exposed differently by the platform. Where no I/O completes in a collection interval, some readings can be zero or otherwise unsuitable for comparing active-workload latency.
A second supported read-only sample can collect I/O rate for the total logical volume set:
Get-Counter -Counter '\LogicalDisk(_Total)\Disk Transfers/sec' -SampleInterval 2 -MaxSamples 3
Use Get-Counter -ListSet LogicalDisk to discover exact local paths if needed. Do not equate I/O operations reported for a logical volume with individual NAND flash operations inside an SSD. Windows also has logman counter collector commands for longer captures, but a short read-only series is sufficient for the introductory exercise. Larger production captures should follow established change control, privacy review and capacity planning.
Worked Calculation: IOPS, Bytes, and Queueing
Consider a hypothetical service completing 1,000 transfers per second with an average request size of 4 KiB (4,096 bytes). Its approximate throughput is 1,000 × 4,096 = 4,096,000 bytes/s, equivalent to 3.90625 MiB/s using 1 MiB = 1,048,576 bytes. The same 1,000 IOPS at 128 KiB per request would transfer approximately 125 MiB/s. Therefore, an IOPS value without request-size context cannot describe throughput.
In a separate steady-state classroom example, imagine 240 completed I/O operations per second with 12 milliseconds of mean time in the measured system. The relationship L = λ × W, often called Little’s law, estimates the mean number of outstanding requests in that same measurement boundary: 240/s × 0.012 s = 2.88 outstanding I/Os. The estimate assumes a stable system and consistent definitions; it is not automatically equal to a particular device’s physical waiting-queue counter and does not imply fractional individual requests exist at any instant.
Finally, convert 0.045 seconds of read latency to 45 milliseconds. A drive showing 45 ms at the time of a user complaint deserves investigation in its hardware and workload context; do not instantly label it failed. Determine whether sustained load, paging, write-back activity, controller timeouts, or the virtual-storage path is responsible.
Troubleshooting Workflow and Evidence Handling
- Confirm scope: which application is slow, since when, and during what workload? Record device identity, Windows version, time zone and the user-visible symptom.
- Check available disk space and application errors, then inspect OSITC.010 Reliability Monitor or the System event log for relevant dated events. A disk-related event ID requires provider, message, and timing context.
- Open Resource Monitor to identify high-activity processes. Distinguish file I/O attributable to a process from disk device response time; process counters may include non-disk I/O.
- Collect a bounded disk performance sample with PerfMon or the read-only PowerShell commands; compare periods of normal load with the incident window.
- Evaluate IOPS alongside request size, latency, workload type, and queue behavior. Inspect per-disk instances rather than relying exclusively on
_Total. - If repeated I/O errors, device warnings, or data-integrity concerns appear, prioritize safeguarding data and follow the organization’s storage replacement and escalation procedure. Do not run destructive testing or disable protective services to make a graph look better.
- Write a short report stating measured observations, possible causes, unresolved uncertainties, and the next authorized diagnostic step.
Common Misdiagnoses
- 100% active time proves a bad disk: false. Sustained active time signals work or contention and must be interpreted with response time, workload and service demand.
- High queue length always means disk failure: false. Some devices are designed for concurrent work; inspect queue trends, latency and throughput together.
- SSD specifications determine local IOPS: false. Workload request size, queue depth, thermal conditions and test design affect results.
- Process I/O counters measure only physical disk operations: false. Process counters can also include other I/O categories depending on the counter.
- A single Windows System log event proves failed media: false. Confirm event provider, time, text, pattern, and hardware evidence.
- Running an intensive benchmark is the safest first step: false. Extra load can disrupt production or make a damaged system less reliable. Prefer existing telemetry first.
Practical Exercise and Assessment
This lab is designed to be non-destructive: read-only observation, calculation, and documentation. Do not open a real HDD, alter disk partitions, reformat volumes, disable antivirus, or run unapproved stress benchmarks. On an approved training machine, inspect Task Manager’s disk page and list counter paths with PowerShell. Collect only three samples and note whether any counter is unavailable. If no Windows environment is present, use the example values and verified screenshot as a documentation-only exercise.
- Compute the throughput from 500 IOPS with 8 KiB average requests. Answer: 500 × 8192 = 4,096,000 bytes/s ≈ 3.90625 MiB/s.
- Convert 0.008 seconds and 0.070 seconds into milliseconds. Answers: 8 ms and 70 ms.
- At 120 operations/s with 0.025 seconds mean measured response time, estimate the steady-state number of requests in that boundary. Answer: 3.0 outstanding I/Os.
- Explain why high activity on the authentic screenshot cannot establish OSITC.013’s measured latency. Answer: it was captured in another environment after a benchmark and represents its own workload.
- Describe how to distinguish low throughput caused by small request size from poor device performance. Answer: record request size, completed operations, latency, and the intended workload rather than looking at bytes/s alone.
- Name a safe action when dated I/O errors coincide with growing latency. Answer: protect important data, preserve logs and escalate under site policy before more intrusive testing.
Technical References and Next Study
Primary Windows documentation: Microsoft — Troubleshoot performance problems in Windows, Microsoft — Performance history for drives, Microsoft — Get-Counter, Microsoft — Troubleshooting with Performance Monitor, and Microsoft — logman counter collection. Verified photographic sources are identified directly beneath the three media items. For hardware fault isolation rather than performance counters, the OSDCTC.005 server diagnostics lesson provides a complementary hardware perspective.
Conclusion
Storage troubleshooting becomes more reliable when a technician correlates time, latency, IOPS, data volume and workload instead of applying one universal utilization threshold. Windows Task Manager, Resource Monitor, Performance Monitor and PowerShell each provide different parts of the evidence. Reproducible measurements and safe escalation matter more than dramatic performance graphs.
Editor’s Note: OSITC.013 is the next Information Technology lesson after OSITC.012. Its original 1200 × 630 cover is an AI-created fictional illustration of a younger adult female IT technician in an educational workspace; it is not a real person, genuine Windows screenshot or actual instrument recording. Three distinct genuine media sources are credited with applicable license information. All 8 ms, 70 ms, 45 ms, 120 IOPS, 240 IOPS, 500 IOPS, 1,000 IOPS, and sample PowerShell results are identified as illustrative calculations or examples; no Windows execution, hardware test, public-browser playback or independent device-level screenshot inspection is claimed.

On a mobile wallet, display the QR on another screen or use a supported saved-image scanner. Verify the payment destination and the 5,000-satoshi amount before authorizing payment.
We volunteer daily to ensure the information on this platform is Verifiably True. If you would like to support the research, please scan the QR code.


Leave a Reply