
Natural gas generated 1,811 terawatt-hours of U.S. electricity in 2025, more than any other individual source, while wind, solar and coal competed for the next largest slices of America’s power mix. New final data in the Energy Information Administration’s Electric Power Annual, released October 21, 2026, make the full hierarchy measurable. SmartChart #31 uses a sunburst to show how fossil fuels, renewables, nuclear and other technologies contributed to national utility-scale generation.
EIA reported 4,425.029 terawatt-hours of net utility-scale electricity in 2025. Fossil fuels remained the largest family, led by natural gas at 1,811.004 TWh and coal at 734.928 TWh. Nuclear plants supplied 785.304 TWh. The renewable family comprised wind at 461.577 TWh, utility-scale solar photovoltaic at 297.448 TWh, conventional hydropower at 241.303 TWh, plus smaller geothermal, biomass and solar-thermal contributions.
SmartChart #31: A nested view of America’s electricity
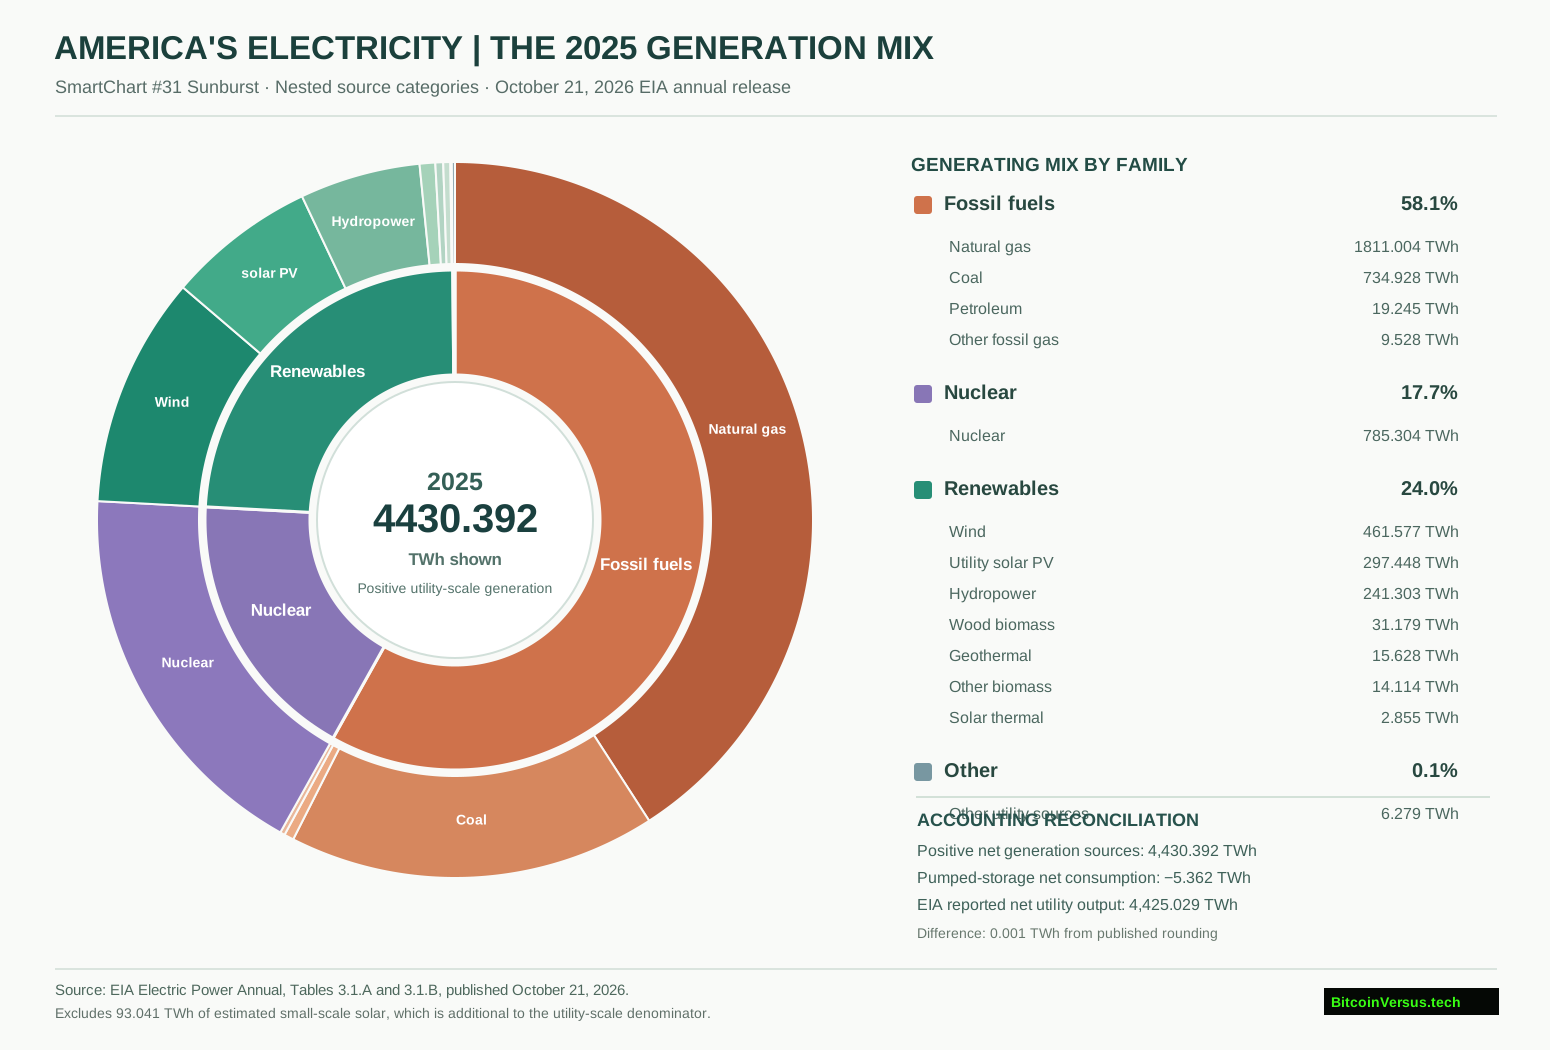
Unlike a pie chart with only broad categories, a sunburst places the overall generation total at its center, families of sources in the first ring, and individual technologies in the outer ring. The 2025 positive-output categories sum to 2,574.705 TWh of fossil generation, 1,064.104 TWh of renewables, 785.304 TWh of nuclear power and 6.279 TWh of other generation. Each child belongs to exactly one parent, so the numbers can be added without double counting.
There is one important accounting adjustment. Pumped-storage hydropower reported negative 5.362 TWh of annual net generation because storing electricity consumes more electricity than it returns. A sunburst cannot give negative values a proportional positive arc. The displayed rings therefore total 4,430.392 TWh; subtracting pumped-storage net consumption gives 4,425.030 TWh, within 0.001 TWh of the EIA’s published total because of rounding.
The original Lawrence Livermore National Laboratory post above describes an earlier national energy-flow analysis. It provides context for the distinction between primary energy and electricity generation, not independent verification of EIA’s 2025 figures. Open the original post if a browser blocks the X widget.
Solar grew while the fuel mix remained diverse
Utility-scale solar generation reached 300.303 TWh when photovoltaic and solar-thermal plants are combined, compared with 219.834 TWh in 2024, an increase of approximately 36.6%. Wind produced 461.577 TWh, up about 2.1%. Coal rose from 652.156 TWh to 734.928 TWh, while natural gas declined from 1,869.902 TWh to 1,811.004 TWh. Yearly output depends on weather, capacity, fuel prices, dispatch decisions and operating availability, not installed nameplate capacity alone.
Small-scale solar is another boundary condition. EIA estimates that rooftop and other sub-1 MW solar systems produced an additional 93.041 TWh in 2025. Those systems are excluded from the utility-scale sunburst so the denominator remains consistent. Including them would require increasing the national total and using a separate small-scale branch rather than silently adding generation to utility-scale solar.
What the 2025 mix means for new power demand
EIA’s November 10, 2026 Short-Term Energy Outlook forecasts utility-scale solar’s share rising from approximately 7% in 2025 to 8% in 2026 and nearly 10% in 2027. Those are forecasts, not observed 2026 annual output. Our national Sankey analysis examines energy conversion losses instead of the source mix, while industrial electricity prices show why geography matters for factories. New battery installations and interregional transmission projects address different parts of grid reliability.
The new breakdown establishes two facts at once: fossil generation still supplied most electricity in 2025, and renewable sources now form a sizable, technically diverse second family. Neither annual production shares nor the sunburst’s slice sizes describe grid reliability hour by hour or electricity costs at a specific data center.
Sources and methods
Primary source: EIA Electric Power Annual, summary Table 1.2, supplemented by renewable-source Table 3.1.B and the November 2026 Short-Term Energy Outlook. Review the SmartChart SVG and reproducible source CSV. Reported values are in terawatt-hours of net electricity generation; total reconciliation is subject to independent rounding.


Leave a Reply