Nearly two-thirds of the energy Americans consumed in 2024 ended up as rejected energy, according to Lawrence Livermore National Laboratory’s latest nationwide energy-flow chart, released September 17, 2026. The federal analysis estimates 94.6 quadrillion British thermal units (quads) of input energy, with 62.27 quads rejected and 32.34 quads delivered as energy services. A new SmartChart Sankey traces the quantities through conversion losses, industry, homes, businesses and transportation.
The chart draws on the Energy Information Administration’s State Energy Data System and uses 2024 observations, not projected 2026 energy consumption. LLNL reported that natural gas rose 1.8% to approximately 34.3 quads and renewable energy climbed 5% to 8.7 quads. Coal declined 3.7% to approximately 7.9 quads. Although the report arrived in 2026, its comparisons concern 2023 and 2024.
SmartChart #32: Where the energy went
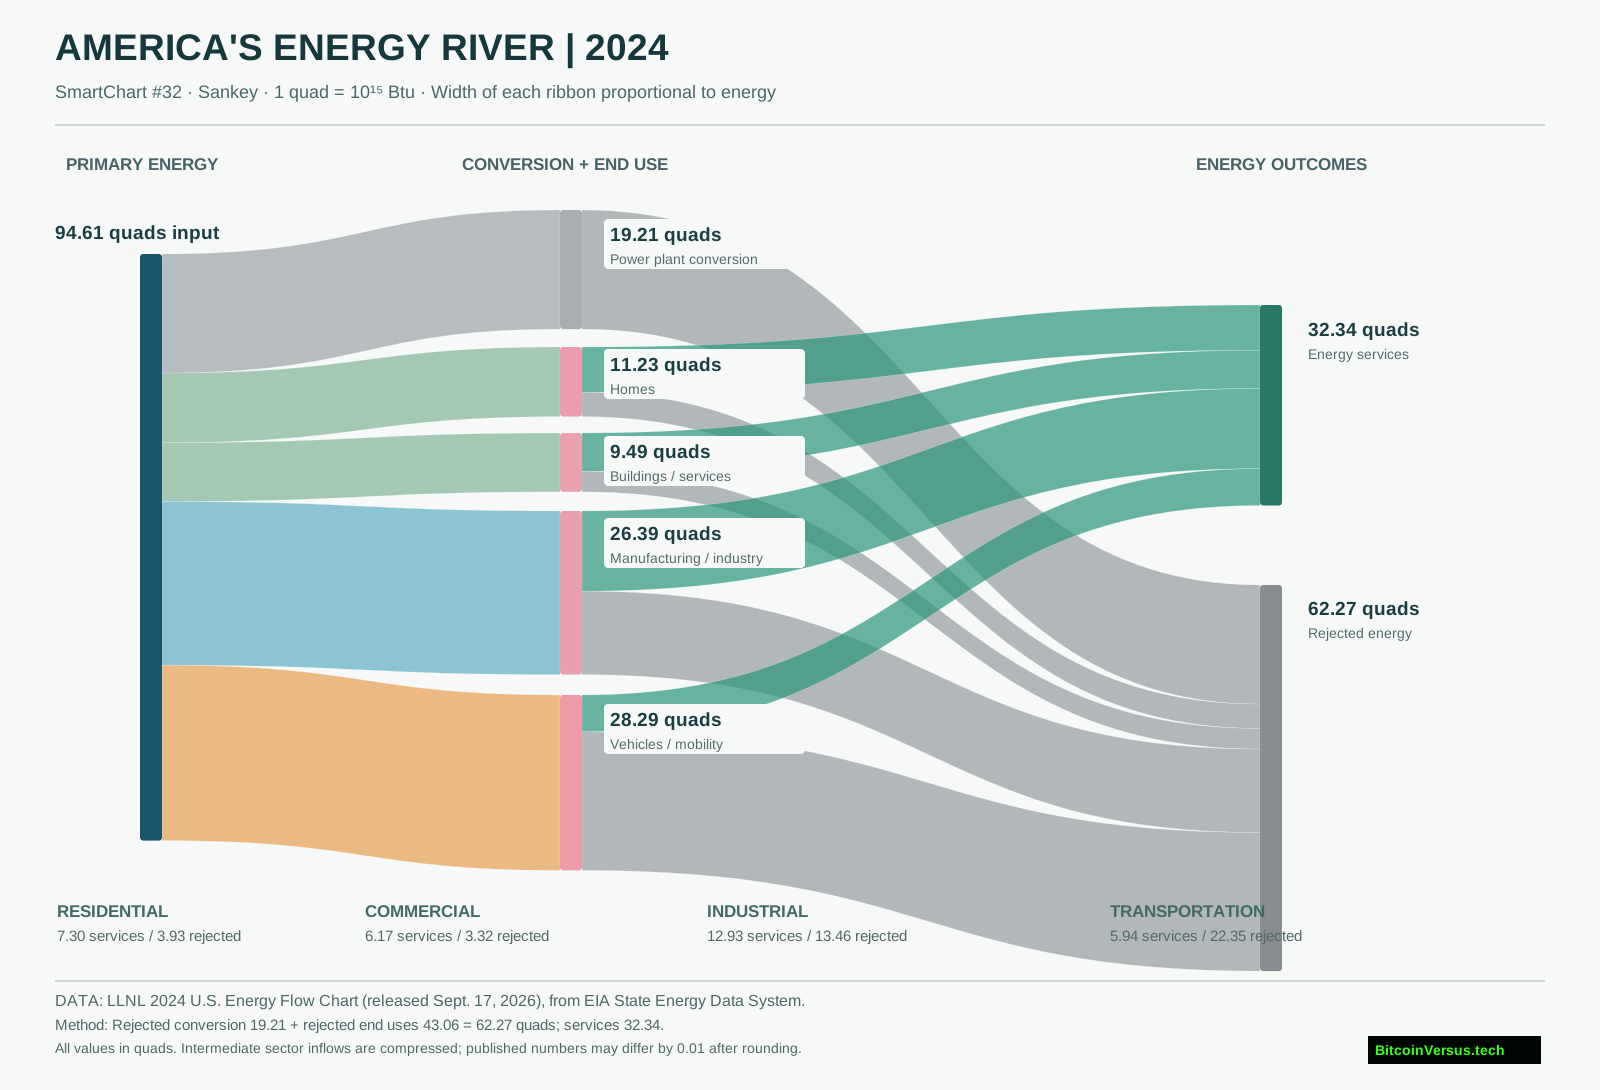
Electricity generation received 32.77 quads of input energy in LLNL’s original chart, delivering 13.56 quads downstream while 19.21 quads entered the rejected-energy category during conversion. The separate end-use sectors received 11.23 quads for residences, 9.49 for commercial activity, 26.39 for industry and 28.29 for transportation. Their combined 75.40 quads represent useful and rejected energy reaching final applications after power-plant conversion losses.
Transportation rejected 22.35 of its 28.29 quads, leaving 5.94 quads assigned to energy services. Industry generated 12.93 quads of services and rejected 13.46. Residential activity produced 7.30 services and 3.93 rejected, while commercial activity recorded 6.17 and 3.32, respectively. Across the sectors, rejected energy totaled 43.06 quads, which, added to generation’s 19.21, reconciles to 62.27.
Lawrence Livermore National Laboratory’s original social announcement accompanies the chart release. The source link is available directly when browser privacy settings prevent the embedded post from rendering.
Rejected energy is not the same as power-grid waste
Rejected energy includes heat dissipated by engines, turbines, electrical generation, buildings and industrial processes under LLNL’s methodological assumptions. The 62.27-quad figure must not be described as electricity lost in transmission lines or as power that could all be recovered with existing technology. Some conversion losses follow thermodynamic limits, while others offer realistic engineering opportunities.
LLNL counts energy services as estimated useful output using sector-specific conversion assumptions. The Sankey therefore measures a modeled physical balance rather than the dollar value of wasted electricity. The distinction matters for any claim about efficiency savings.
Why factories and AI data centers care
Energy-intensive construction amplifies the importance of conversion efficiency and electricity infrastructure. TSMC’s Arizona fabrication timeline shows multiple factories at different development stages; our industrial electricity price map highlights substantial state-level rate differences. The battery deployment map tracks new storage locations, while Wyoming’s proposed intertie underscores the role of transmission capacity.
No national flow chart reveals a particular AI data center’s efficiency, which requires facility-specific metering of IT energy, cooling, electrical conversion and heat rejection. Still, national accounting demonstrates why energy supply, useful work and losses must be measured together. Higher electricity production alone does not establish improved efficiency.
Data and verification
Primary sources: LLNL’s September 17, 2026 news release and the official 2024 energy-flow chart. The SmartChart SVG and source flow dataset contain a simplified, conserved representation. Because printed figures are rounded, the displayed 94.61-quad input can differ by 0.01 from LLNL’s 94.6 headline.


Leave a Reply