
Industrial electricity costs differed by almost eightfold across U.S. states in August 2026, according to new federal data. Hawaii averaged 39.33 cents per kilowatthour (kWh), while New Mexico averaged 5.08 cents. The national industrial average reached 9.64 cents, up from 8.98 cents in August 2025, a 7.3% increase. The figures come from the Energy Information Administration’s Electric Power Monthly, released October 23.
A map is more revealing than a simple national ranking because states sharing regional electricity markets can still show different average charges. The chart uses SmartChart atlas type #39, a choropleth, where each state receives one measured value. Unlike a proportional-symbol map, no circle sizes represent industrial load or the number of factories.
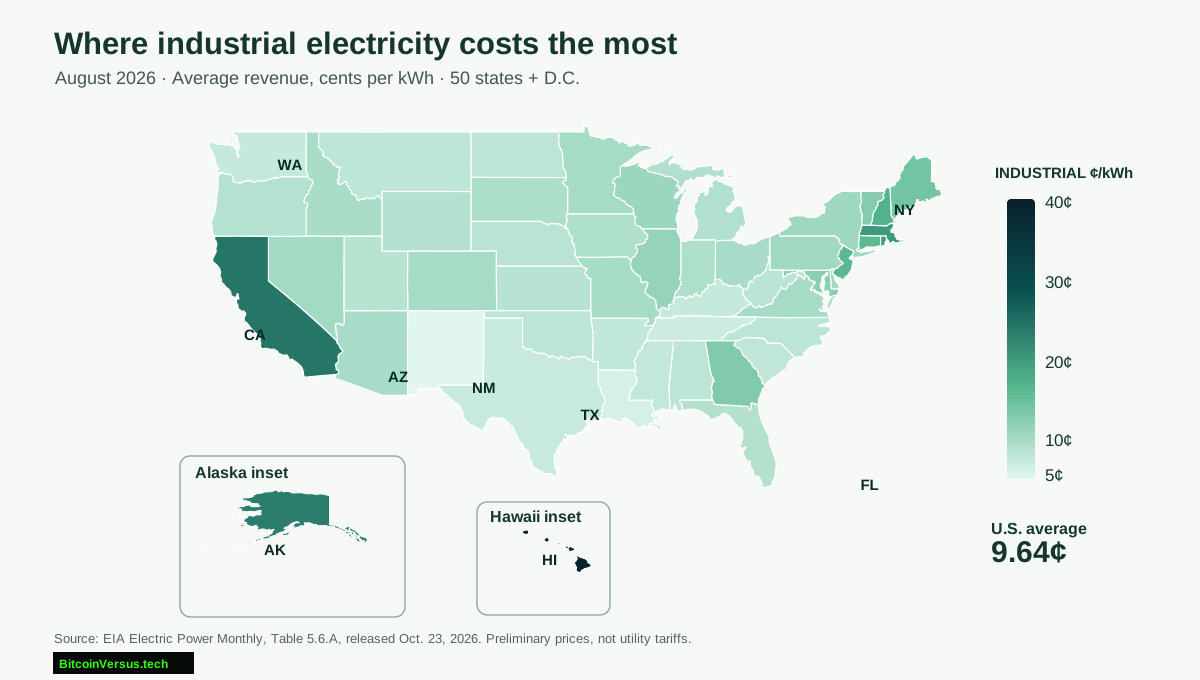
The highest reported state industrial averages were Hawaii at 39.33 cents, California at 24.12 cents and Alaska at 23.13 cents per kWh. Massachusetts followed at 20.03 cents and Rhode Island at 19.87 cents. At the lower end, New Mexico recorded 5.08 cents, Louisiana 6.10 cents, Tennessee 6.92 cents and Texas 7.21 cents. Washington was at 7.43 cents, while Arizona was at 9.73 cents.
For scale, California’s industrial average was about 3.35 times Texas’s. A hypothetical operation consuming 10 million kWh annually would see a roughly $1.69 million difference in energy charges if every kWh were billed at those two reported averages. That calculation illustrates the spread, not an actual quotation for a factory. Real operators negotiate distinct tariffs, power-purchase agreements, demand charges and reliability provisions.
The regional picture matters as the U.S. accelerates chipmaking and computing infrastructure. TSMC’s $265 billion Arizona expansion puts a spotlight on electricity, water and around-the-clock fab operations. Phoenix’s investment announcement does not establish TSMC’s contracted electricity price, and the Arizona state average should never be presented as its actual energy bill.
Phoenix Mayor Kate Gallego’s original investment announcement is embedded above as project context, not as evidence of electricity rates. Read the original social post directly if the embed is blocked by a browser or platform restriction.
Why average electricity prices need careful interpretation
EIA’s monthly price is the average revenue utilities and other providers received per unit of electricity sold to customers classified as industrial. It is not a universal tariff or a wholesale market quote. Providers may classify customers by industry, demand or rate schedule. EIA identifies its 2026 figures as preliminary and cautions that reclassification and billing-period differences can affect comparisons.
Industrial electricity sales totaled 93.7 billion kWh nationwide in August, down 1.5% from a year earlier, while revenue rose 5.8% to about $9.04 billion. The combination helps explain why the average price rose even without higher industrial electricity sales. It does not establish whether AI data centers caused the change; attribution requires location-specific load, rates, generation and grid-cost evidence.
Electricity costs also interact with capacity and reliability. Wyoming’s proposed 1.8 GW intertie highlights transmission constraints, while newly commissioned U.S. battery sites illustrate efforts to shift available power across hours. The expanding data-center project pipeline adds urgency to discussions of who funds grid upgrades and how industrial customers are billed.
The central finding is geographic, not causal: a nationwide industrial price conceals enormous state differences. For a new fab or data center, electricity rate structure, guaranteed capacity, connection schedule and grid reliability must be evaluated together. State averages provide a starting benchmark, not a substitute for project-specific engineering and commercial due diligence.
Data and methodology
Source: EIA Electric Power Monthly Table 5.6.A, August 2026 preliminary observations compared with August 2025 final data. The map includes 50 states and Washington, D.C.; states are colored by cents per kWh, with Alaska and Hawaii shown as insets. Download the exact chart dataset and review the original chart.


Leave a Reply