
A newly released archive of U.S. Geological Survey earthquake records reveals how dramatically Oklahoma-region seismic activity has changed. In a fixed study rectangle covering Oklahoma and nearby border areas, 2,253 magnitude-3-or-greater earthquakes were recorded during 2013–2016, compared with just 61 during 2022–2025. The reduction is 97.3% across two equally long periods. SmartChart #27 plots every event as a real coordinate-driven hexbin, rather than approximating seismic hotspots.
The underlying 3,079-event dataset comes from USGS ComCat and was preserved by Live Atlas in an October 29, 2026 release. Its regional boundary extends from 33.6° to 37.1° north and 103.1° to 94.4° west, so totals cannot be presented as official Oklahoma state counts. The preserved catalog covers 2000 through October 2026; the visualization compares complete four-year windows to prevent incomplete-year distortion.
SmartChart #27: Where the earthquake clusters went
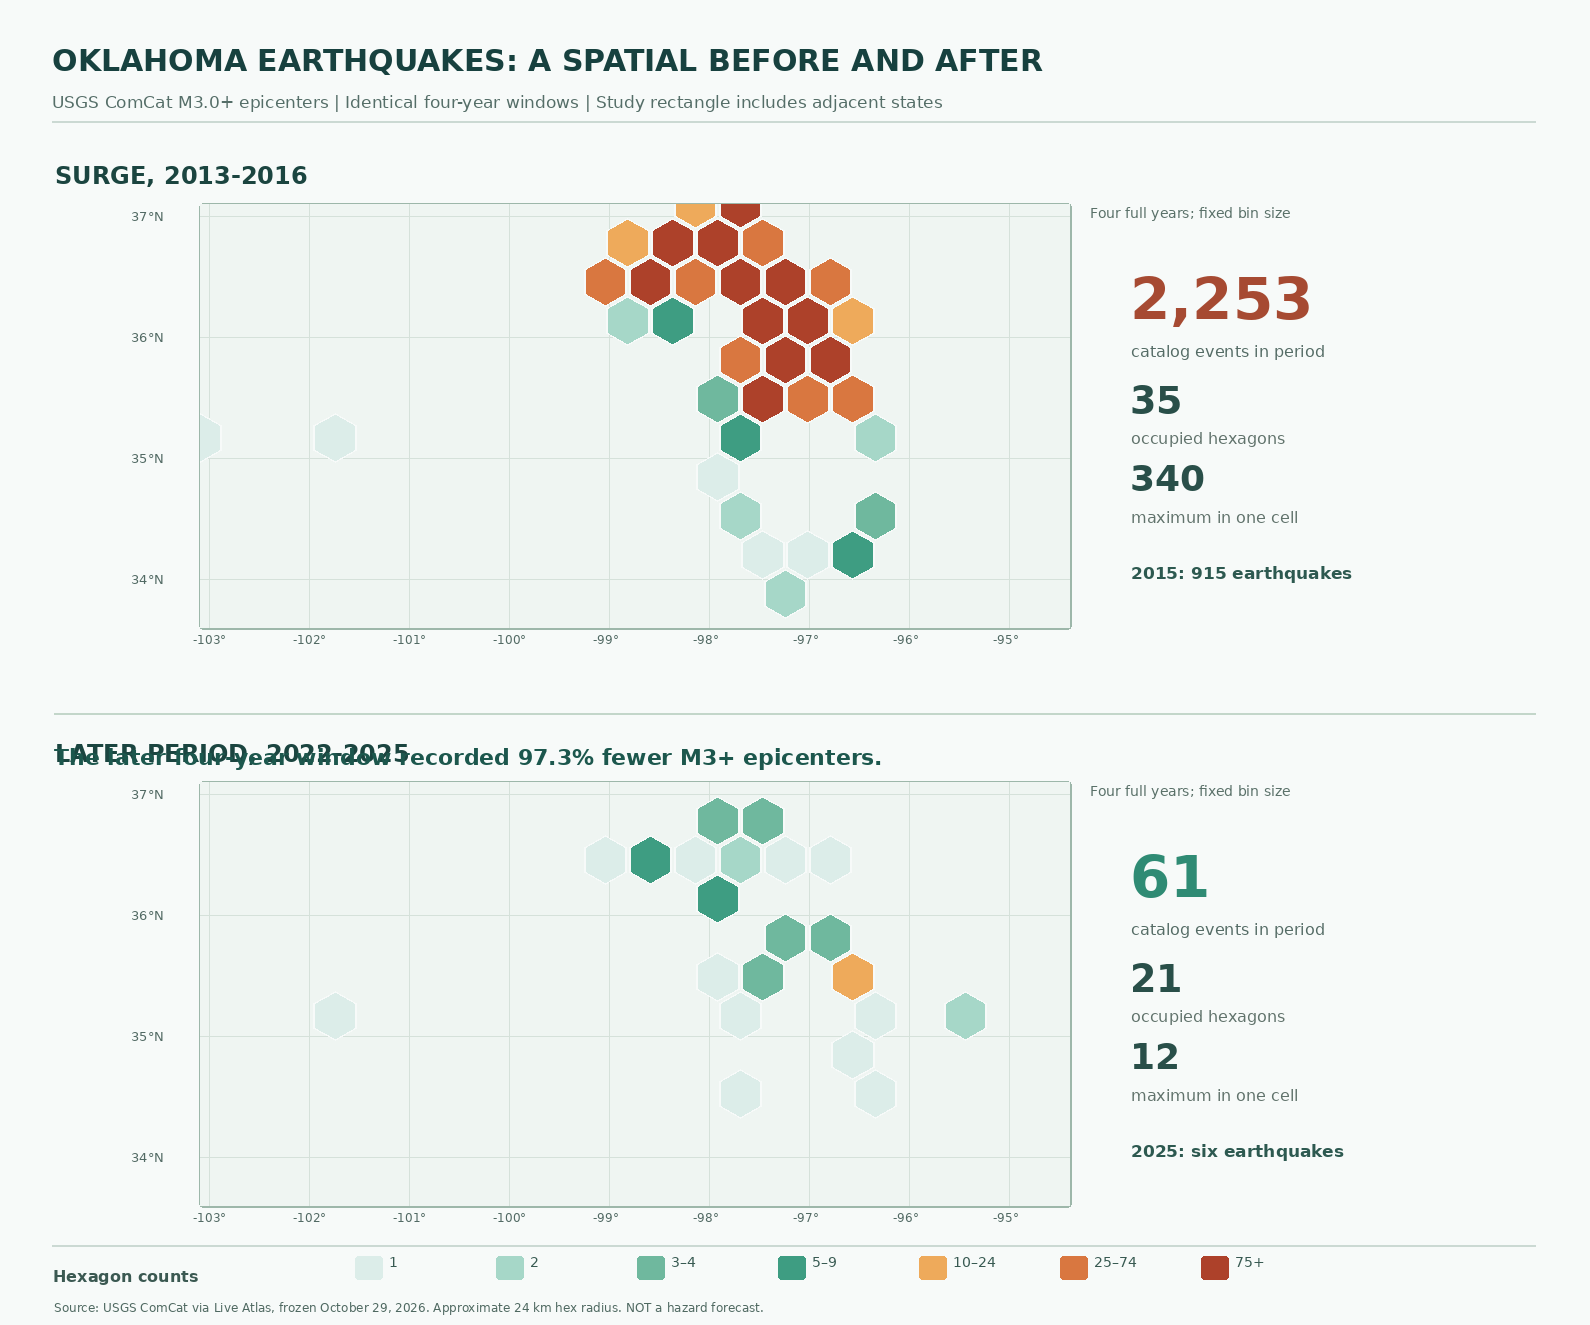
The 2013–2016 period featured concentrated epicenters across north-central Oklahoma and neighboring areas. The busiest approximately 24-kilometer-radius hexagon contains 340 events, compared with 12 in the later window’s busiest cell. Each epicenter is assigned to exactly one hexagon, both maps use identical geographic extents and color thresholds, and the 2,253 and 61 cell counts independently reconcile to the source data.
The archive records 915 regional events in 2015 and six during the full year 2025. Published state-only studies sometimes report different 2015 figures because borders, magnitude revisions and catalog selection rules differ. A small aftershock cluster can also dominate one hexagon without showing increased shaking risk across an entire county.
Wastewater disposal changed the seismic landscape
USGS research identifies deep wastewater disposal associated with oil and gas production as the principal driver of Oklahoma’s 2010s induced-earthquake surge. High-volume injection can increase pore pressure near pre-existing faults and reduce resistance to slip. The process is distinct from hydraulic fracturing itself: USGS attributes relatively few Oklahoma earthquakes directly to fracking operations.
State regulators restricted some injection volumes and required changes in disposal-well depths. Research published by the Seismological Society of America found that lower injection rates and shallower disposal contributed to reduced seismicity. Falling oil-and-gas production also affected injection activity, so a map alone cannot assign a percentage of the decline to any individual policy.
Smaller counts do not mean earthquakes stopped. The magnitude 5.8 Pawnee earthquake occurred in September 2016, and a magnitude 5.1 event near Prague was recorded in February 2024. Earthquake magnitude, accumulated seismic energy and building vulnerability cannot be inferred from event density alone. The USGS does not identify an individual wastewater well as the cause of every epicenter on the map.
What engineers should take from the data
The engineering distinction is relevant to drilling and fracking operations, natural-gas production, and advanced geothermal drilling, where fluid handling, subsurface pressure and fault geometry require careful assessment. Seismic testing of grid transformers illustrates a separate resilience question: protecting infrastructure against strong shaking.
Reproducible sources and limitations
The original source is Live Atlas’s October 2026 USGS ComCat archive, credited under CC BY 4.0, supplemented by USGS induced-seismicity research and Oklahoma Corporation Commission reporting. The SmartChart hexbin, bin-level CSV and full event dataset permit independent recalculation. The chart is historical event-density analysis, not an earthquake warning.
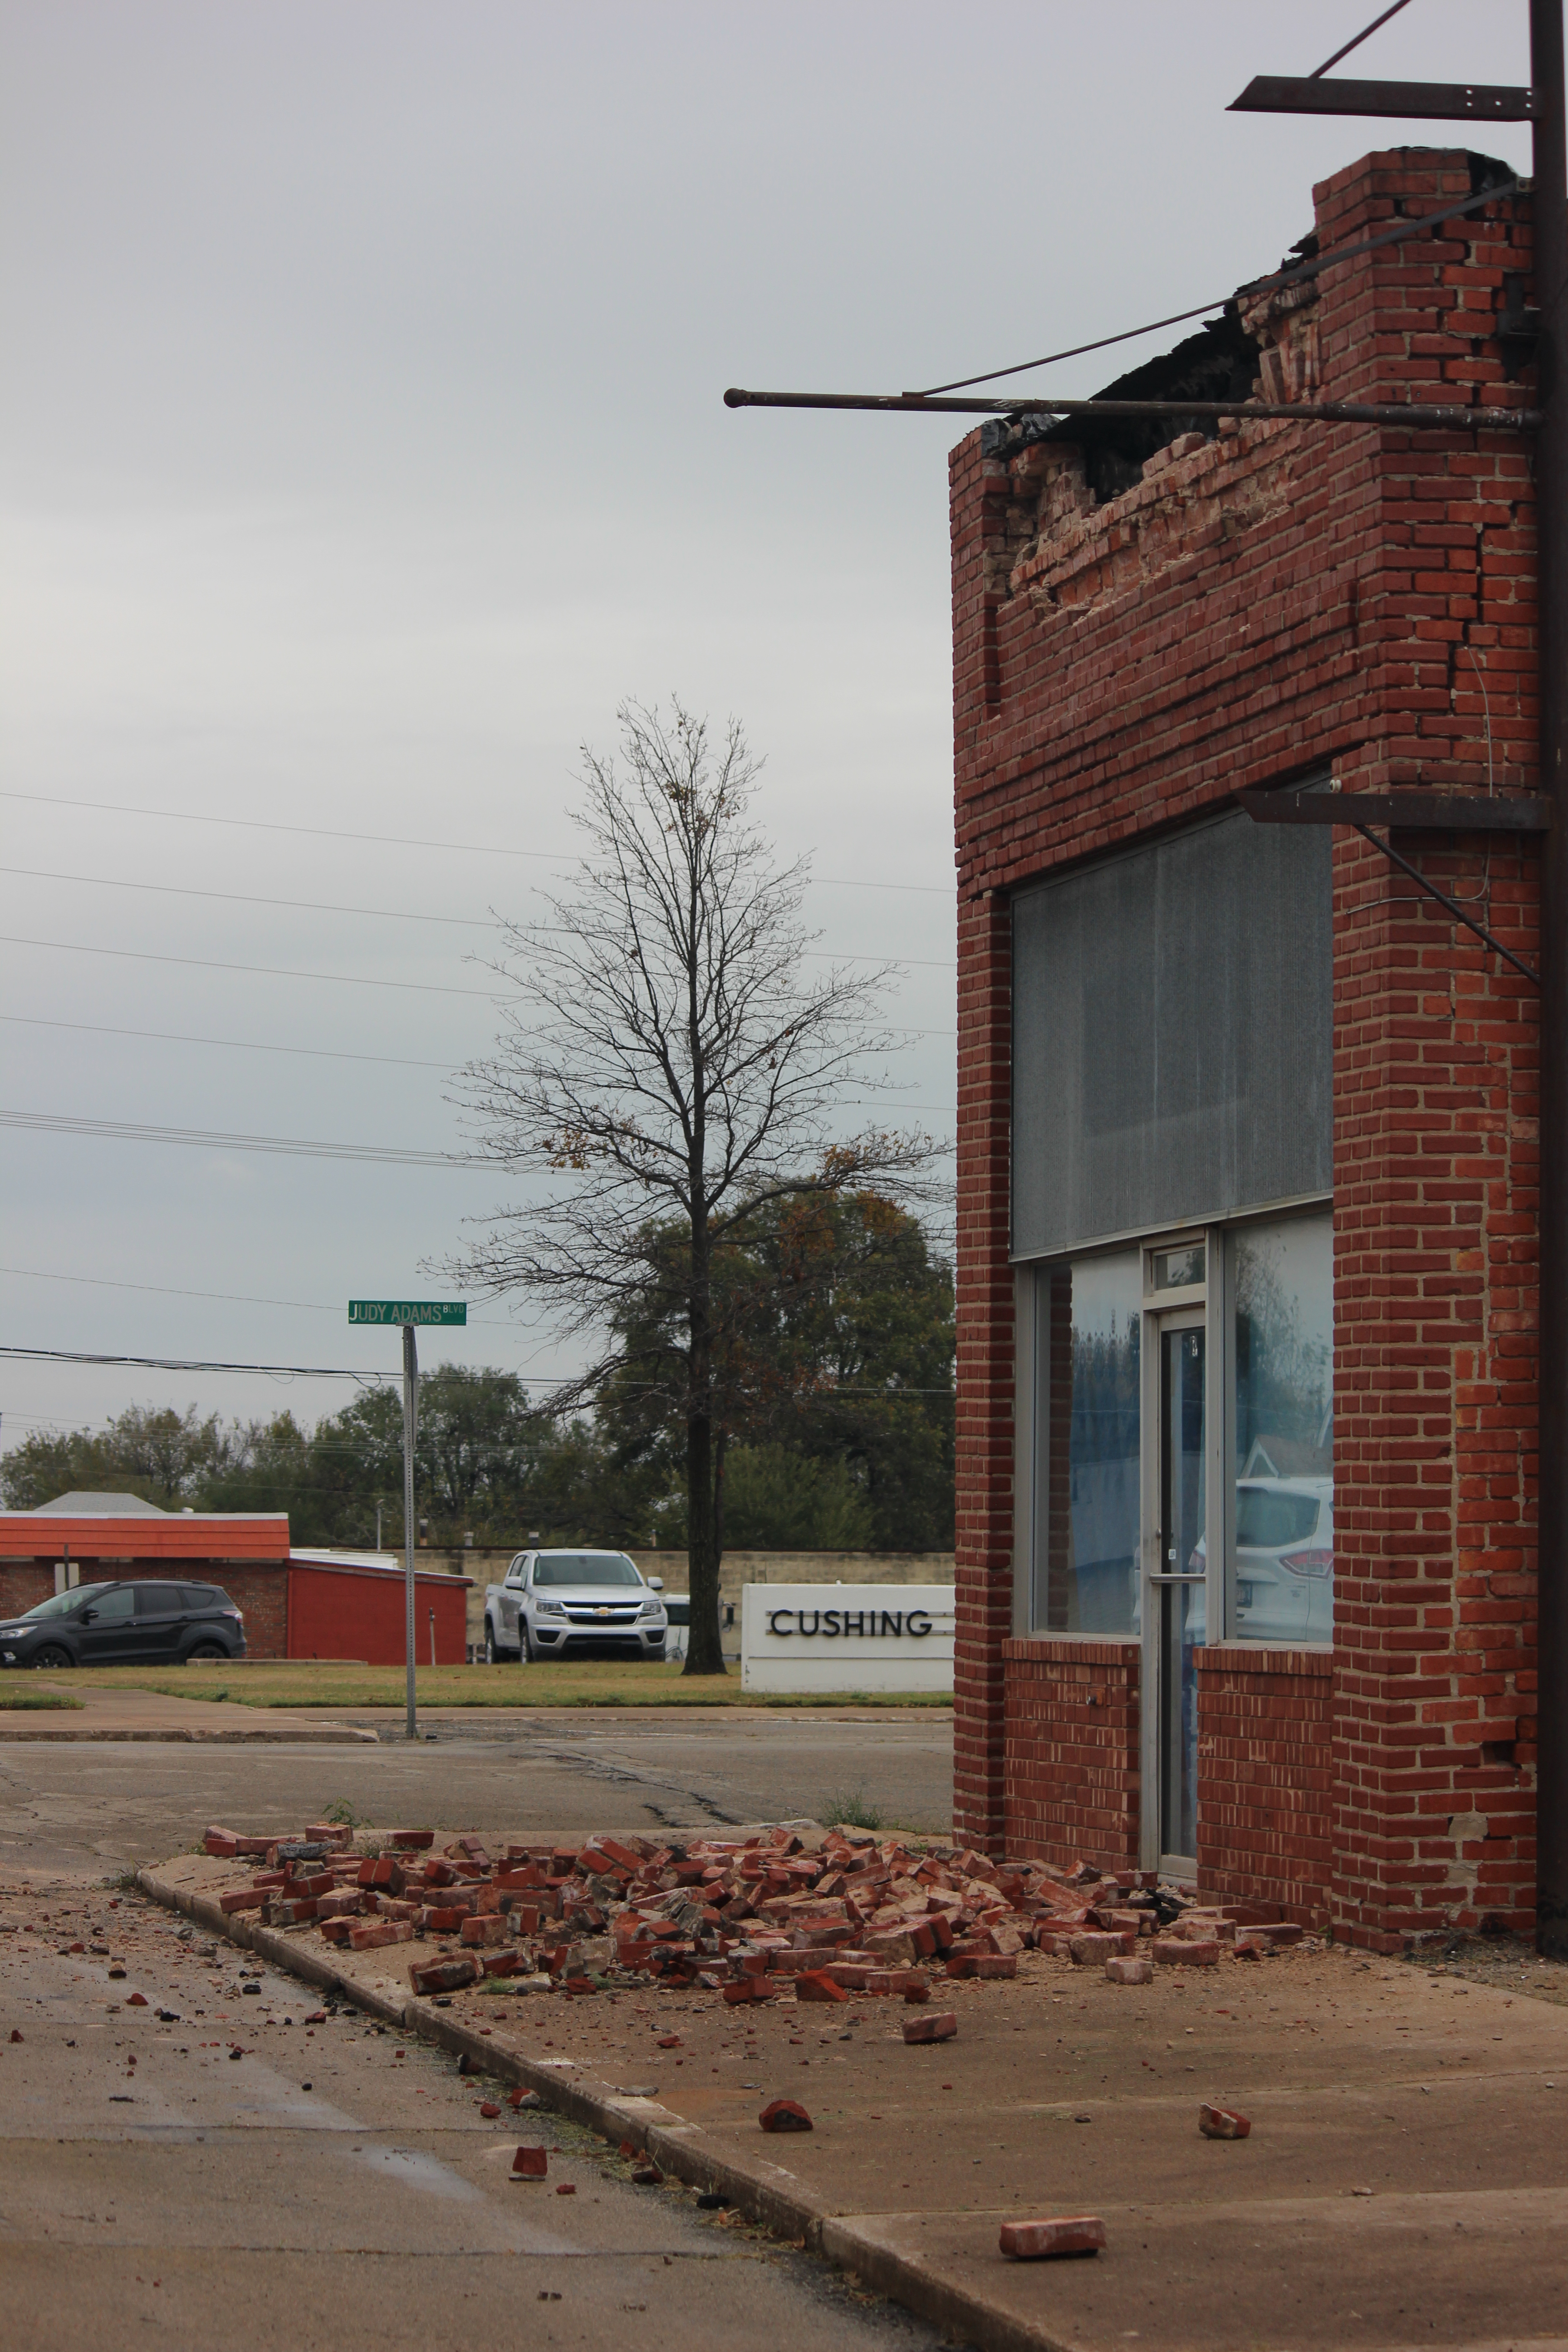
Editor’s Note: The colored-pencil featured cover is conceptual. The Cushing damage photograph is an authentic USGS archival image, credited to Dolan Paris. The two geology lecture videos precede the dataset release. A relevant, verifiable original-source social post could not be established and no social link was fabricated. Browser playback, public SVG loading and mobile display remain outstanding tests.

BitcoinVersus.Tech publishes independent volunteer-supported technology reporting. Readers may optionally contribute 5,000 satoshis. Before sending, independently verify recipient 3C9o19EH5HSiwEPyCTmEKzxhNCbo2X6TTb and payment amount; Bitcoin transactions are generally irreversible.
We volunteer daily to ensure the information on BitcoinVersus.Tech is Verifiably True. Coverage is educational and informational, not personalized engineering, legal, financial or earthquake emergency guidance.


Leave a Reply