
The 12-month PEI follow-up is useful precisely because it exposes a weakness of short Power Efficiency Index windows: one noisy endpoint can dominate the result. Re-running the comparison with the same Oct. 11 daily-hashrate convention across 12, 24 and 48 months makes the contrast much clearer.
The Power Efficiency Index uses PEI = (H₂ ÷ H₁) × (E₁ ÷ E₂), where hashrate growth is combined with improvement in leading ASIC efficiency. Relative Price is then Physical Price × PEI, with Physical Price defined as the lowest observed Bitcoin price inside the chosen interval.
Method update: these three charts standardize the endpoint to Oct. 11, 2026, when the daily network estimate was 1,029 EH/s. YCharts, using Blockchain.com data, also reports 1,102 EH/s one year earlier. Daily hashrate is inherently noisy, which is one reason the 12-month reading should not be over-read.
12-Month PEI
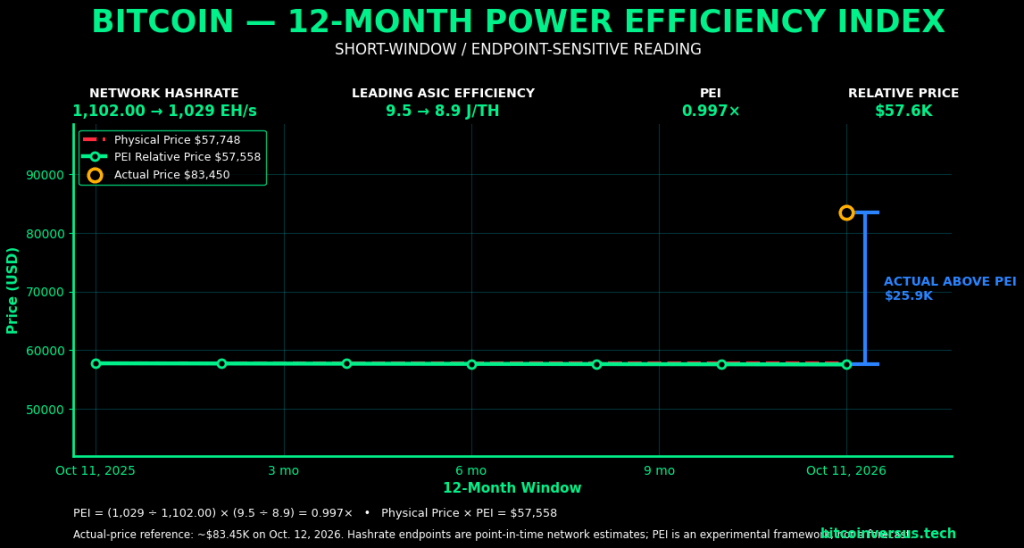
This is the endpoint-sensitive reading. A single 12-month slice can capture curtailment, weather, miner shutdowns, migration or simple block-time variance. It can also compare an announced efficiency frontier with a network that has not yet broadly deployed that hardware.
24-Month PEI
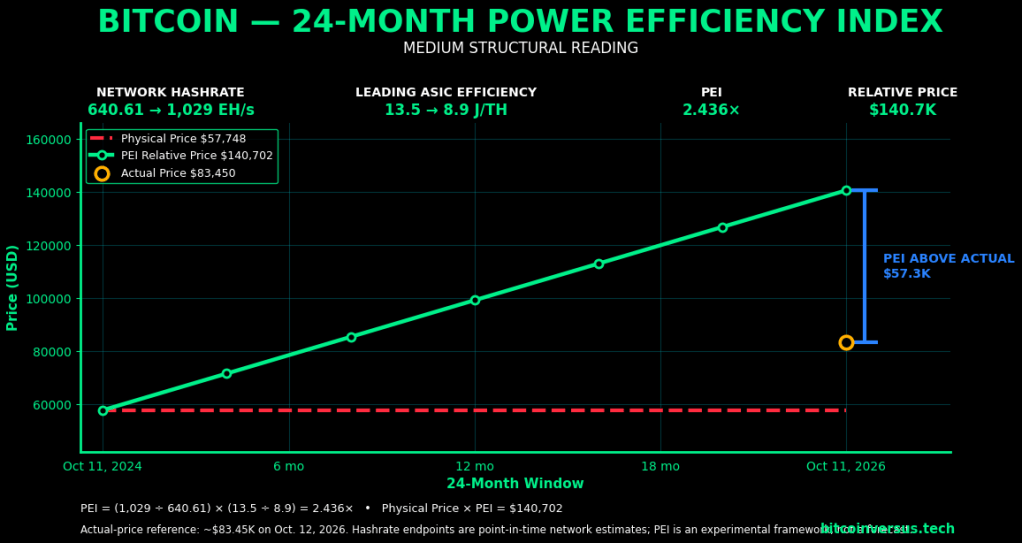
At 24 months, the index spans more of an ASIC replacement cycle. Hashrate growth has more time to compound and temporary network conditions have less influence on the full comparison. This does not make the reading a guaranteed fair value; it makes it a more structural measurement of the physical network progression PEI is designed to capture.
48-Month PEI
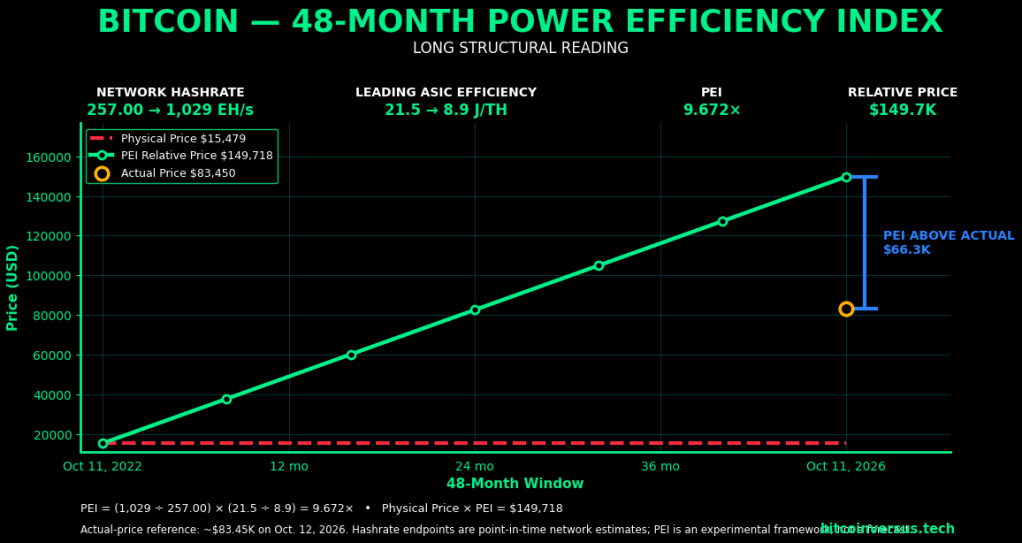
The 48-month window captures several generations of SHA-256 hardware and roughly a fourfold increase in network hashrate. That makes it less sensitive to one unusual week or month. It is also why a long-window PEI should be described as a structural reading, not automatically as a more accurate Bitcoin price forecast.
Why the Windows Disagree
The three readings are not contradictory. They answer different questions. The 12-month window asks what the network did recently. The 24-month window captures a broader technology cycle. The 48-month window captures several cycles of hashrate expansion and efficiency gains. When all three agree, the PEI signal is stronger. When they diverge this sharply, the disagreement itself is useful information.
This also helps explain why our earlier 18-month PEI analysis can point in a different direction from a one-year snapshot. Longer windows reduce endpoint sensitivity, although they introduce their own complications: halvings, regulatory shocks, migration events and unusually deep Physical Price lows can all influence the result.
WDMS 2026 footage of the S23 XP Hyd. is a useful reminder that the 8.9 J/TH frontier is real as a manufacturer-rated product specification, while broad fleet deployment comes later.
WDMS 2026 coverage of Bitmain’s S23 XP Hyd. launch. Canonical video: YouTube.
Data notes: the Oct. 11, 2026 and one-year-ago network endpoints come from YCharts/Blockchain.com. The Oct. 11, 2024 endpoint is 640.61 EH/s in Ultramining’s historical series. Contemporary October 2022 reporting put network hashrate near 257 EH/s. The 2022 Physical Price uses the Nov. 21 intraday low near $15,479. The 8.9 J/TH endpoint is the manufacturer-rated S23 XP Hyd. specification discussed in our S23 XP Hyd. coverage.
Editor’s Note: PEI is an experimental comparative framework. The charts are intended to compare physical network progression across time windows, not to promise a future Bitcoin price or provide financial advice.
If you would like to support BitcoinVersus.tech research, donations are accepted at: 3C9o19EH5HSiwEPyCTmEKzxhNCbo2X6TTb
BitcoinVersus.tech is not a financial advisor. This media platform reports on financial and technical subjects for informational and research purposes.


Leave a Reply