
Bitcoin mining may be approaching a point where improvements in ASIC efficiency become relevant to more than miner profitability.
BitcoinVersus.Tech’s Bitcoin Mining Singularity defines 1 joule per terahash as a major hardware milestone: one joule of energy required for each terahash of SHA-256 computation.
We are not there yet. BITMAIN currently lists the S23 XP Hyd. at 600 TH/s, 5,340 W and 8.9 J/TH. But the approach toward 1 J/TH raises a larger question: could dramatically greater computational output per megawatt become one of the physical catalysts that helps push Bitcoin toward hyperbitcoinization?
Our answer is possibly—but not automatically. This report introduces a testable BitcoinVersus.Tech hypothesis, not an established economic law: the region from roughly 3 J/TH down toward 1 J/TH may become a Hyperbitcoinization Pressure Zone in which Bitcoin’s physical infrastructure becomes materially more powerful per unit of electricity.
The 8.9 J/TH Starting Point
BITMAIN’s official product listing gives the S23 XP Hyd. a manufacturer-rated efficiency of 8.9 J/TH. The machine is listed at 600 TH/s and 5,340 watts.
That rating is important, but it is still a manufacturer specification for futures hardware rather than a broad body of independently measured field results. The distinction matters because this entire model should be updated as deployed machines generate real wall-power and pool-side data.
Where the 8.3% Rate Comes From
The current scenario comes from BitcoinVersus.Tech’s 8.3% Singularity update. The model compares a 9.5 J/TH baseline with 8.9 J/TH, a raw reduction of about 6.32%.
Because the comparison interval was treated as roughly nine months, that change was annualized using compounding:
1 − (8.9 ÷ 9.5)12/9 ≈ 8.33%
For clarity, this is best described as an 8.3% compounded annual reduction in J/TH. It is not a guarantee that ASIC efficiency will continue improving at that exact rate.
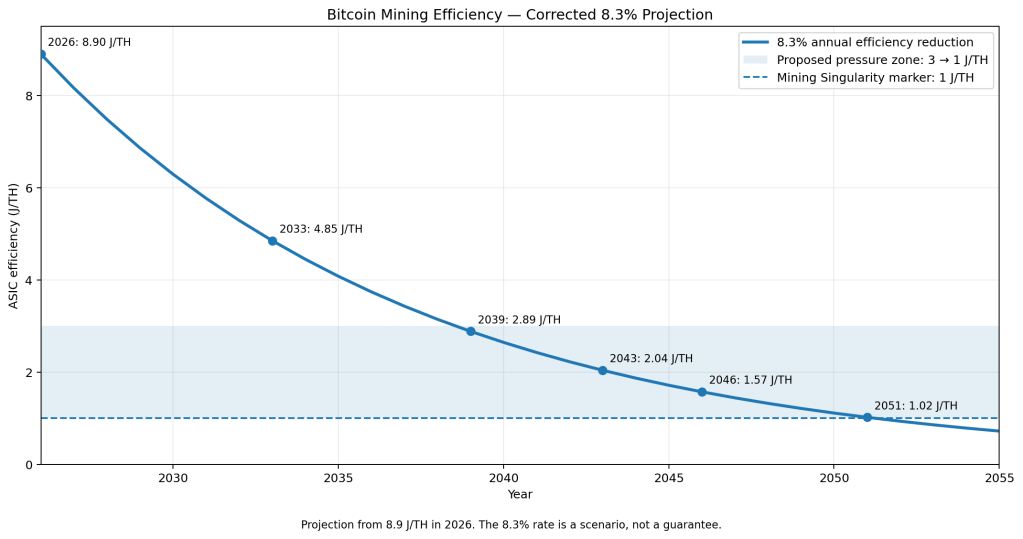
Using 8.9 J/TH in 2026 as the new starting point, the projection becomes:
J(t) = 8.9 × (1 − 0.083)(t − 2026)
| Year | Projected Efficiency |
|---|---|
| 2026 | 8.90 J/TH |
| 2033 | 4.85 J/TH |
| 2039 | 2.89 J/TH |
| 2043 | 2.04 J/TH |
| 2046 | 1.57 J/TH |
| 2051 | 1.02 J/TH |
This correction is important. At an 8.3% annual reduction, the exact 1 J/TH crossing is closer to 2051, not 2046. The earlier 2033–2039 Mining Singularity window depended on substantially faster historical efficiency scenarios, roughly 15%–25% per year.
The Hyperbitcoinization Pressure Zone
That slower projection does not eliminate the original thesis. It changes the question.
Instead of treating 1 J/TH as a single magic date, BitcoinVersus.Tech proposes watching the entire region from roughly 3 J/TH to 1 J/TH. Under the 8.3% scenario, that zone begins around 2039 and extends into the early 2050s.
The reason is physical rather than monetary. At fixed power, lower J/TH means more SHA-256 computation can be produced by the same electrical infrastructure.
| ASIC Efficiency | Idealized Hashrate at 10 MW |
|---|---|
| 8.9 J/TH | 1.12 EH/s |
| 5 J/TH | 2.00 EH/s |
| 3 J/TH | 3.33 EH/s |
| 2 J/TH | 5.00 EH/s |
| 1.57 J/TH | 6.37 EH/s |
| 1 J/TH | 10.00 EH/s |
A 10 MW machine load running at 1 J/TH would therefore perform about 8.9 times as much SHA-256 work as an idealized 10 MW load running at 8.9 J/TH.
That is the central physical observation behind this report.
What the 10 MW Profitability Chart Really Shows
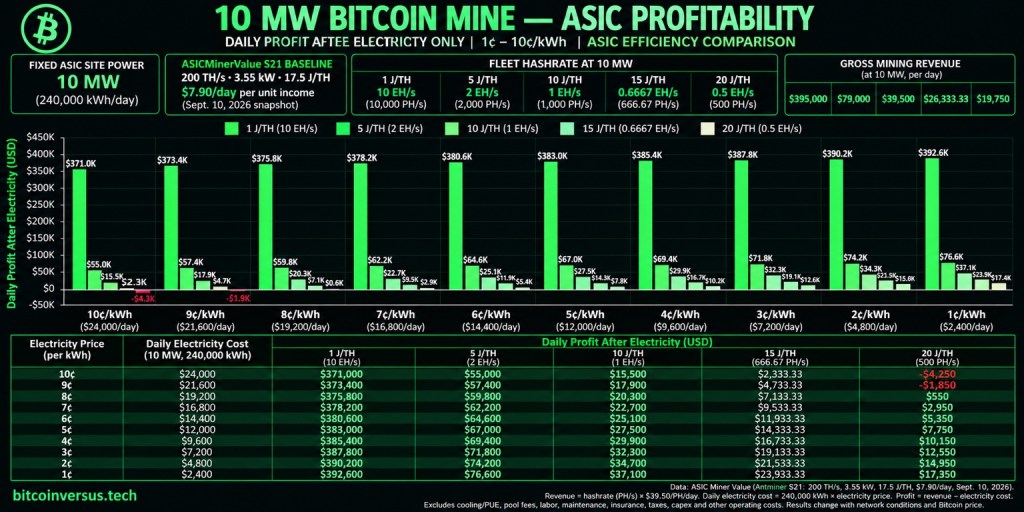
The second chart shows why lower J/TH can look economically explosive when revenue per unit of hashrate is held constant.
At 10 MW, 1 J/TH corresponds to 10 EH/s, or 10,000 PH/s. At a frozen hashprice of about $39.50 per PH/s per day, that produces an illustrative gross revenue figure of roughly $395,000 per day. The same 10 MW uses 240,000 kWh per day, so electricity costs range from $2,400 per day at 1¢/kWh to $24,000 per day at 10¢/kWh.
But that arithmetic must not be mistaken for a 2040s profit forecast.
Bitcoin mining difficulty adjusts as hashrate enters or leaves the network. If the entire mining industry becomes dramatically more efficient, network difficulty should absorb much of the advantage. Hashprice is also affected by Bitcoin’s market price, block subsidy, transaction fees and global hashrate. Luxor’s September 2026 data, for example, placed monthly average USD hashprice near $39.33/PH/day—useful for a current sensitivity test, but not something that should be held constant for decades.
So the stronger long-term claim is not “1 J/TH guarantees enormous mining profits.” It is that 1 J/TH radically increases the amount of computational work that can be produced from a fixed electrical envelope.
Why Energy Integration Matters
Bitcoin mining already behaves differently from many conventional data-center loads. Mining equipment can often be curtailed rapidly, relocated to energy sources that are difficult to monetize, and operated behind the meter when economics permit.
A 2026 research paper in The Electricity Journal treats Bitcoin mining as a potential large flexible load while arguing that participation should depend on auditable grid, environmental and cost-allocation conditions. That nuance matters: flexibility can be valuable, but it is not automatically beneficial in every grid or jurisdiction.
If ASIC efficiency continues falling, each megawatt could support progressively more Bitcoin computation. That may make marginal energy sources more useful to miners, reduce the energy cost per unit of hashrate and make mining infrastructure more adaptable across grids and behind-the-meter projects.
Hyperbitcoinization Is Still a Monetary Event
The term hyperbitcoinization predates this mining theory. Daniel Krawisz described it as a form of Bitcoin-induced currency demonetization in which people voluntarily move toward Bitcoin as competing money loses monetary demand. His original argument is economic and monetary—not an ASIC-efficiency forecast. The Satoshi Nakamoto Institute preserves the original 2014 essay.
That is why BitcoinVersus.Tech is not claiming that 1 J/TH mechanically causes hyperbitcoinization.
The proposed relationship is narrower: an extreme improvement in energy-to-computation efficiency could strengthen the physical layer beneath Bitcoin at the same time that monetary adoption expands above it.
In that framework, the chain of influence would look something like this:
- Lower J/TH produces more hashrate per megawatt.
- More efficient fleets can reduce energy cost per unit of SHA-256 work.
- Mining becomes easier to integrate with a wider range of energy assets and flexible-load strategies.
- Greater global mining capacity can increase the physical resources competing to secure Bitcoin.
- A stronger and more geographically adaptable physical layer may reinforce confidence in Bitcoin as monetary infrastructure.
- If payments, savings, reserves, credit markets and settlement adoption also expand, that infrastructure may become one reinforcing force inside a much larger hyperbitcoinization process.
What Could Break the Thesis?
A professional forecast also needs failure conditions.
First, the efficiency curve could flatten. Semiconductor scaling, voltage leakage, heat density, interconnect resistance, packaging cost and manufacturing economics can make each additional J/TH improvement harder.
Second, 1 J/TH hardware could arrive but remain too expensive to deploy broadly. Efficiency alone does not determine fleet economics; capital cost, cooling, transformers, switchgear, maintenance, financing and machine availability matter.
Third, enormous gains in fleet efficiency can concentrate mining rather than decentralize it if only a few operators can afford next-generation infrastructure.
Fourth, Bitcoin can become physically stronger without becoming the dominant money. Hyperbitcoinization would still require human adoption: savings behavior, merchant acceptance, liquidity, self-custody, payments, credit, institutional use and potentially sovereign adoption.
Finally, network difficulty means efficiency gains do not create free economic output. Competitive miners eventually bid those gains back into the network.
What We Should Measure From Here
The hypothesis becomes useful only if it can be tested. BitcoinVersus.Tech will watch several variables together:
- Best commercially available and independently measured ASIC J/TH.
- Network hashrate produced per gigawatt of estimated mining load.
- Hashprice and energy hashprice as difficulty responds to new hardware.
- Capital cost per TH/s and per MW of deployed mining infrastructure.
- The share of mining connected to stranded, curtailed, behind-the-meter or demand-responsive energy.
- Bitcoin adoption metrics outside mining: payments, reserves, self-custody, settlement, corporate holdings and sovereign use.
The related Power Efficiency Index remains a separate experimental framework for studying the relationship between computational growth, efficiency and valuation. Neither PEI nor the Hyperbitcoinization Pressure Zone should be interpreted as a guaranteed Bitcoin price model.
Conclusion
The most defensible claim is not that hyperbitcoinization begins on the day an ASIC reaches 1 J/TH.
It is that the approach toward 1 J/TH could represent a period in which Bitcoin’s physical infrastructure becomes dramatically more computationally dense, flexible and economically integrated with global energy systems.
Under the current 8.3% scenario, the proposed pressure zone begins near 3 J/TH around 2039, reaches roughly 2 J/TH around 2043, approaches 1.57 J/TH around 2046 and nears the 1 J/TH Mining Singularity around 2051.
Faster historical efficiency rates would pull that timetable forward. Slower diminishing returns would push it back.
That makes 1 J/TH less useful as a prophecy than as a physical benchmark. If Bitcoin is simultaneously becoming more widely held, spent, settled and used as reserves while its security infrastructure moves through the 3-to-1 J/TH range, the overlap may prove important.
That is the hypothesis we can now test.
BitcoinVersus.Tech Editor’s Note:
We volunteer daily to ensure the credibility of the information on this platform is Verifiably True. If you would like to support to help further secure the integrity of our research initiatives, please donate using the QR code provided

For best QR-code scanning results, please scan this donation code from a desktop or larger screen. Mobile screens may prevent camera recognition.


Leave a Reply