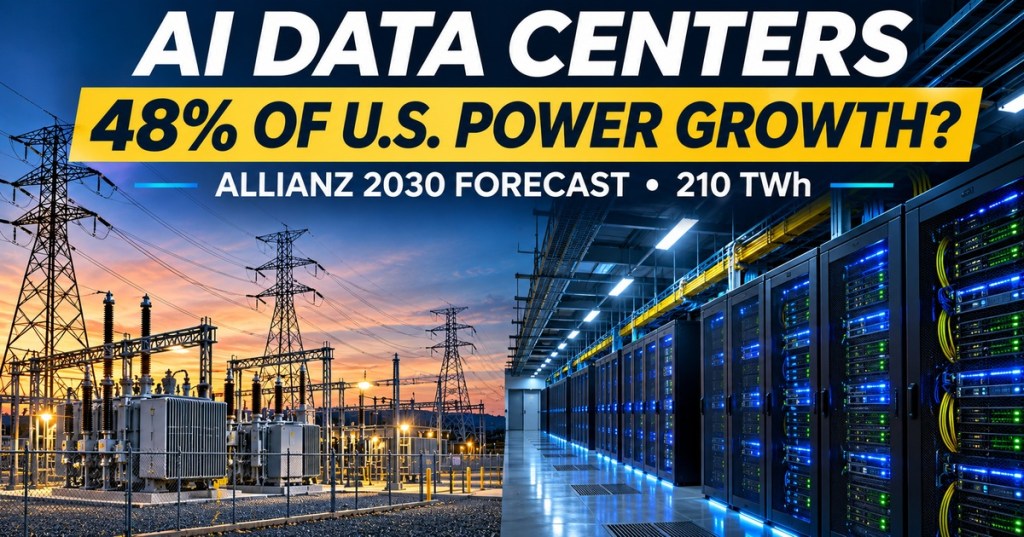
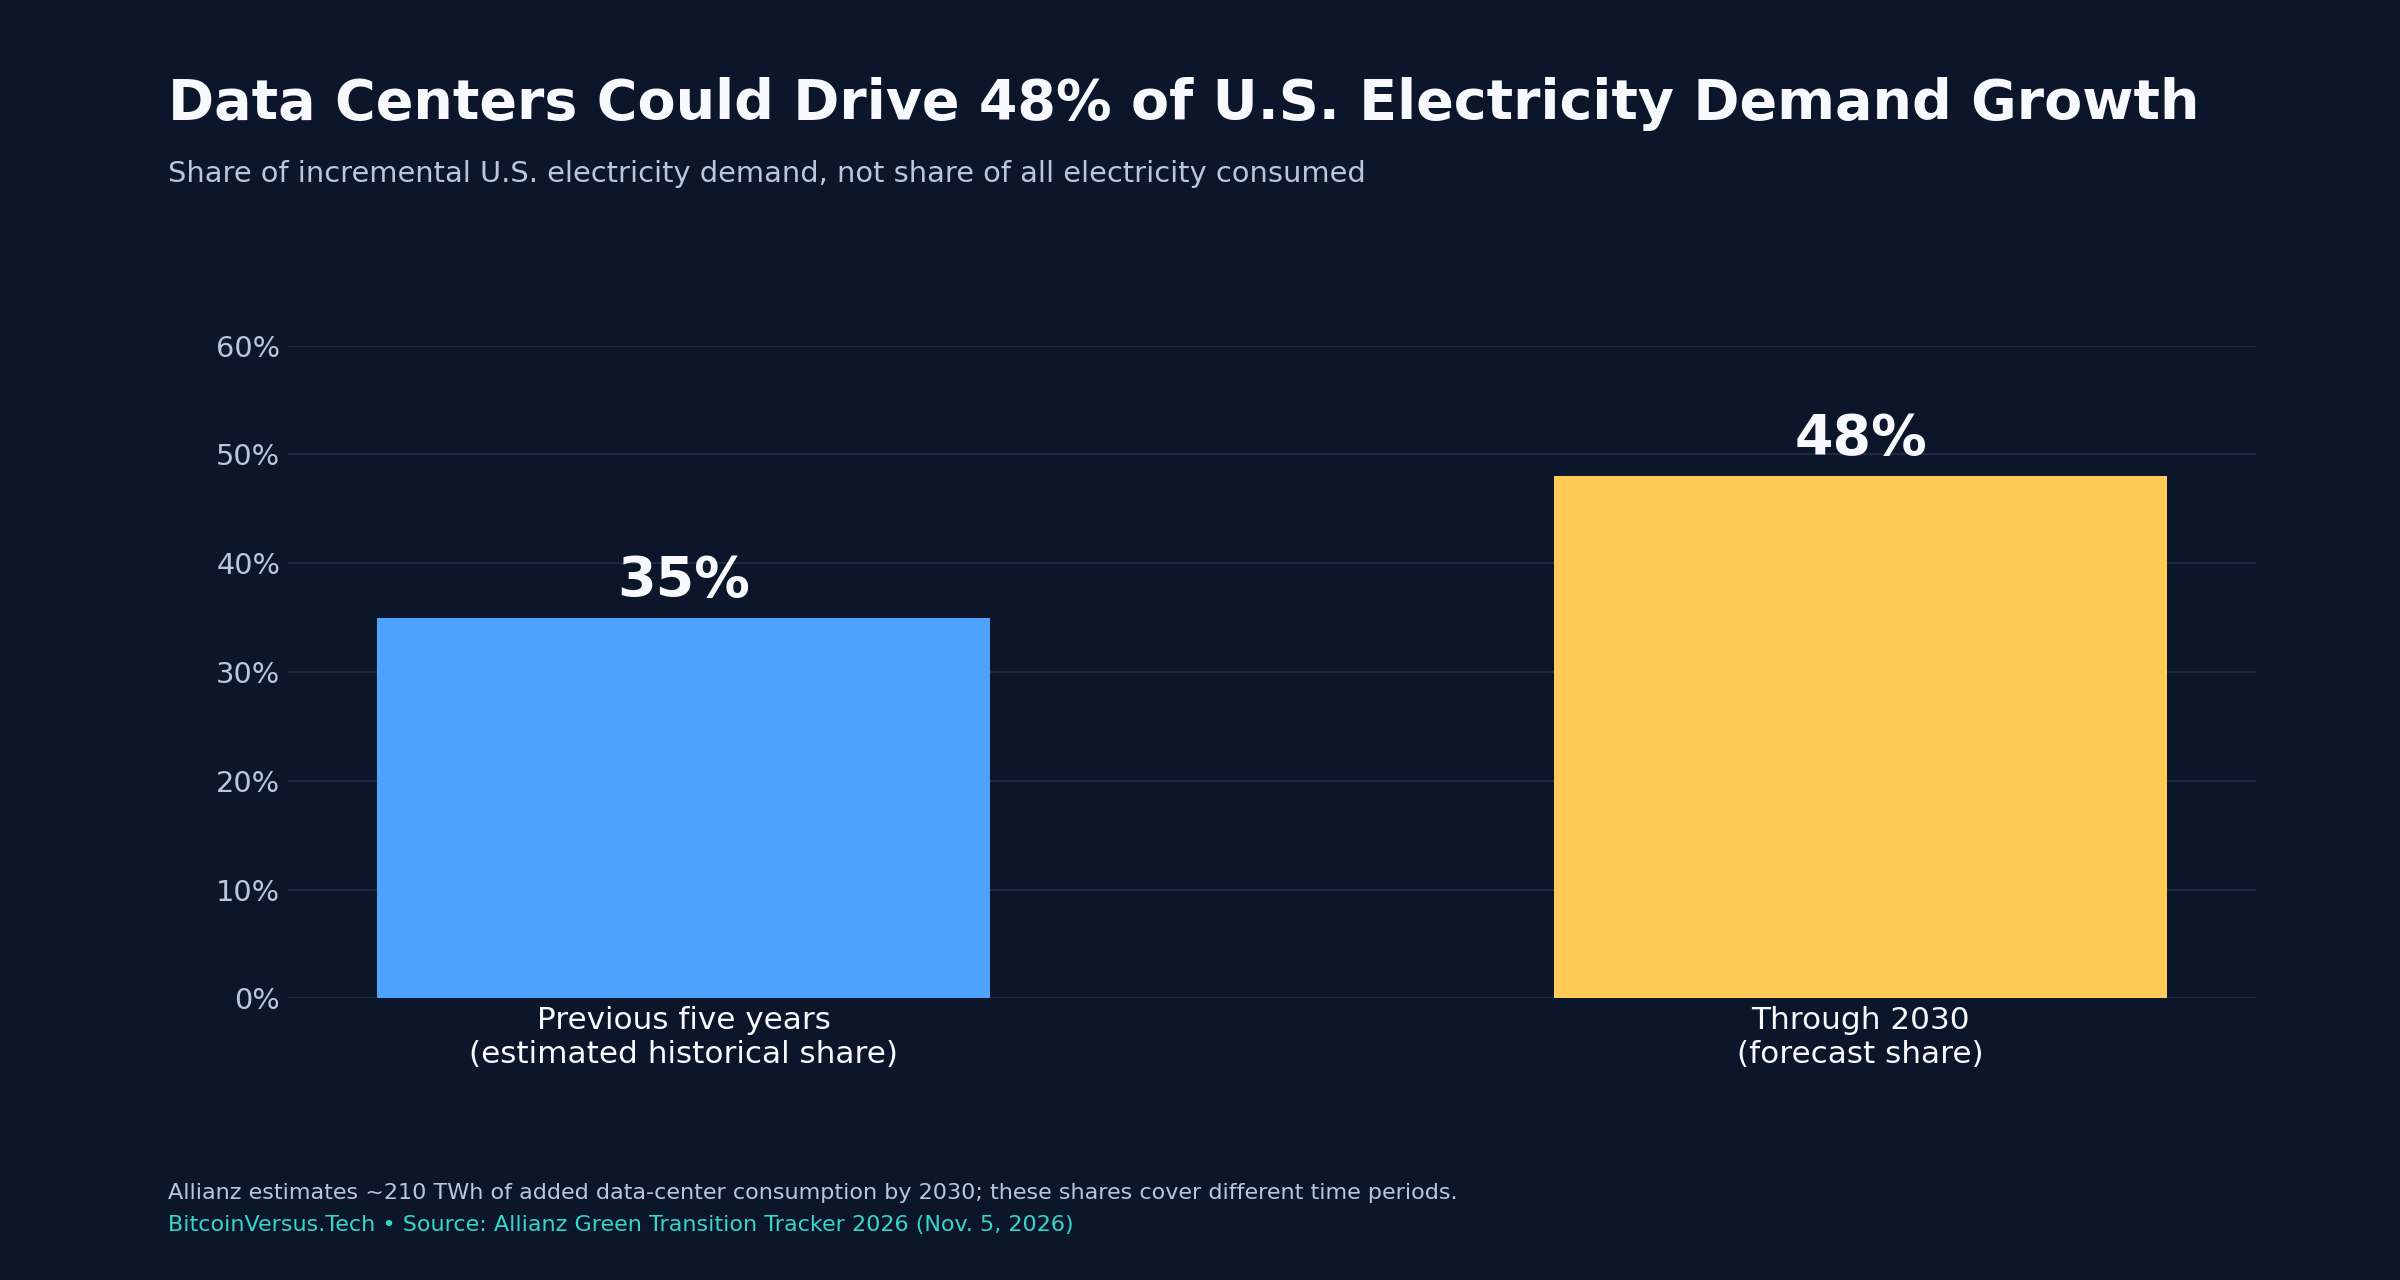
Data centers could drive 48% of additional U.S. electricity demand through 2030, according to a November 5, 2026 analysis by Allianz Research. The same study attributes approximately 35% of demand growth during the preceding five years to data centers. Its forecast calls for about 210 terawatt-hours (TWh) of additional annual consumption by 2030, highlighting the challenge of providing electricity to expanding AI infrastructure. The percentages measure shares of growth, not the portion of all American electricity consumed by data centers.
What 210 TWh actually means
A terawatt-hour measures energy over time. One TWh is one billion kilowatt-hours. By contrast, megawatts and gigawatts describe power at a moment or a rated maximum. Allianz projects more than 400 TWh of additional annual U.S. electricity demand from all sectors by 2030, or roughly 9% growth. Demand also rises with industrial production, electric vehicles, heating and cooling.
A data center’s electricity requirement includes servers, networking equipment, cooling, power conversion and supporting systems. Facility demand depends on utilization, efficiency and the rate at which new buildings become operational. Earlier BitcoinVersus.Tech coverage examined OpenAI’s proposed reporting of data-center power and water use. Neither a proposed megawatt connection nor a contracted future facility proves equivalent annual electricity consumption.
The U.S. Energy Information Administration’s October outlook independently anticipates continued commercial-sector electricity growth, including data centers. It does not independently verify Allianz’s 48% attribution or assign the same 210-TWh estimate. Both forecasts depend on equipment deployment, industrial activity, weather and evolving assumptions.
Grid and storage spending could rise faster
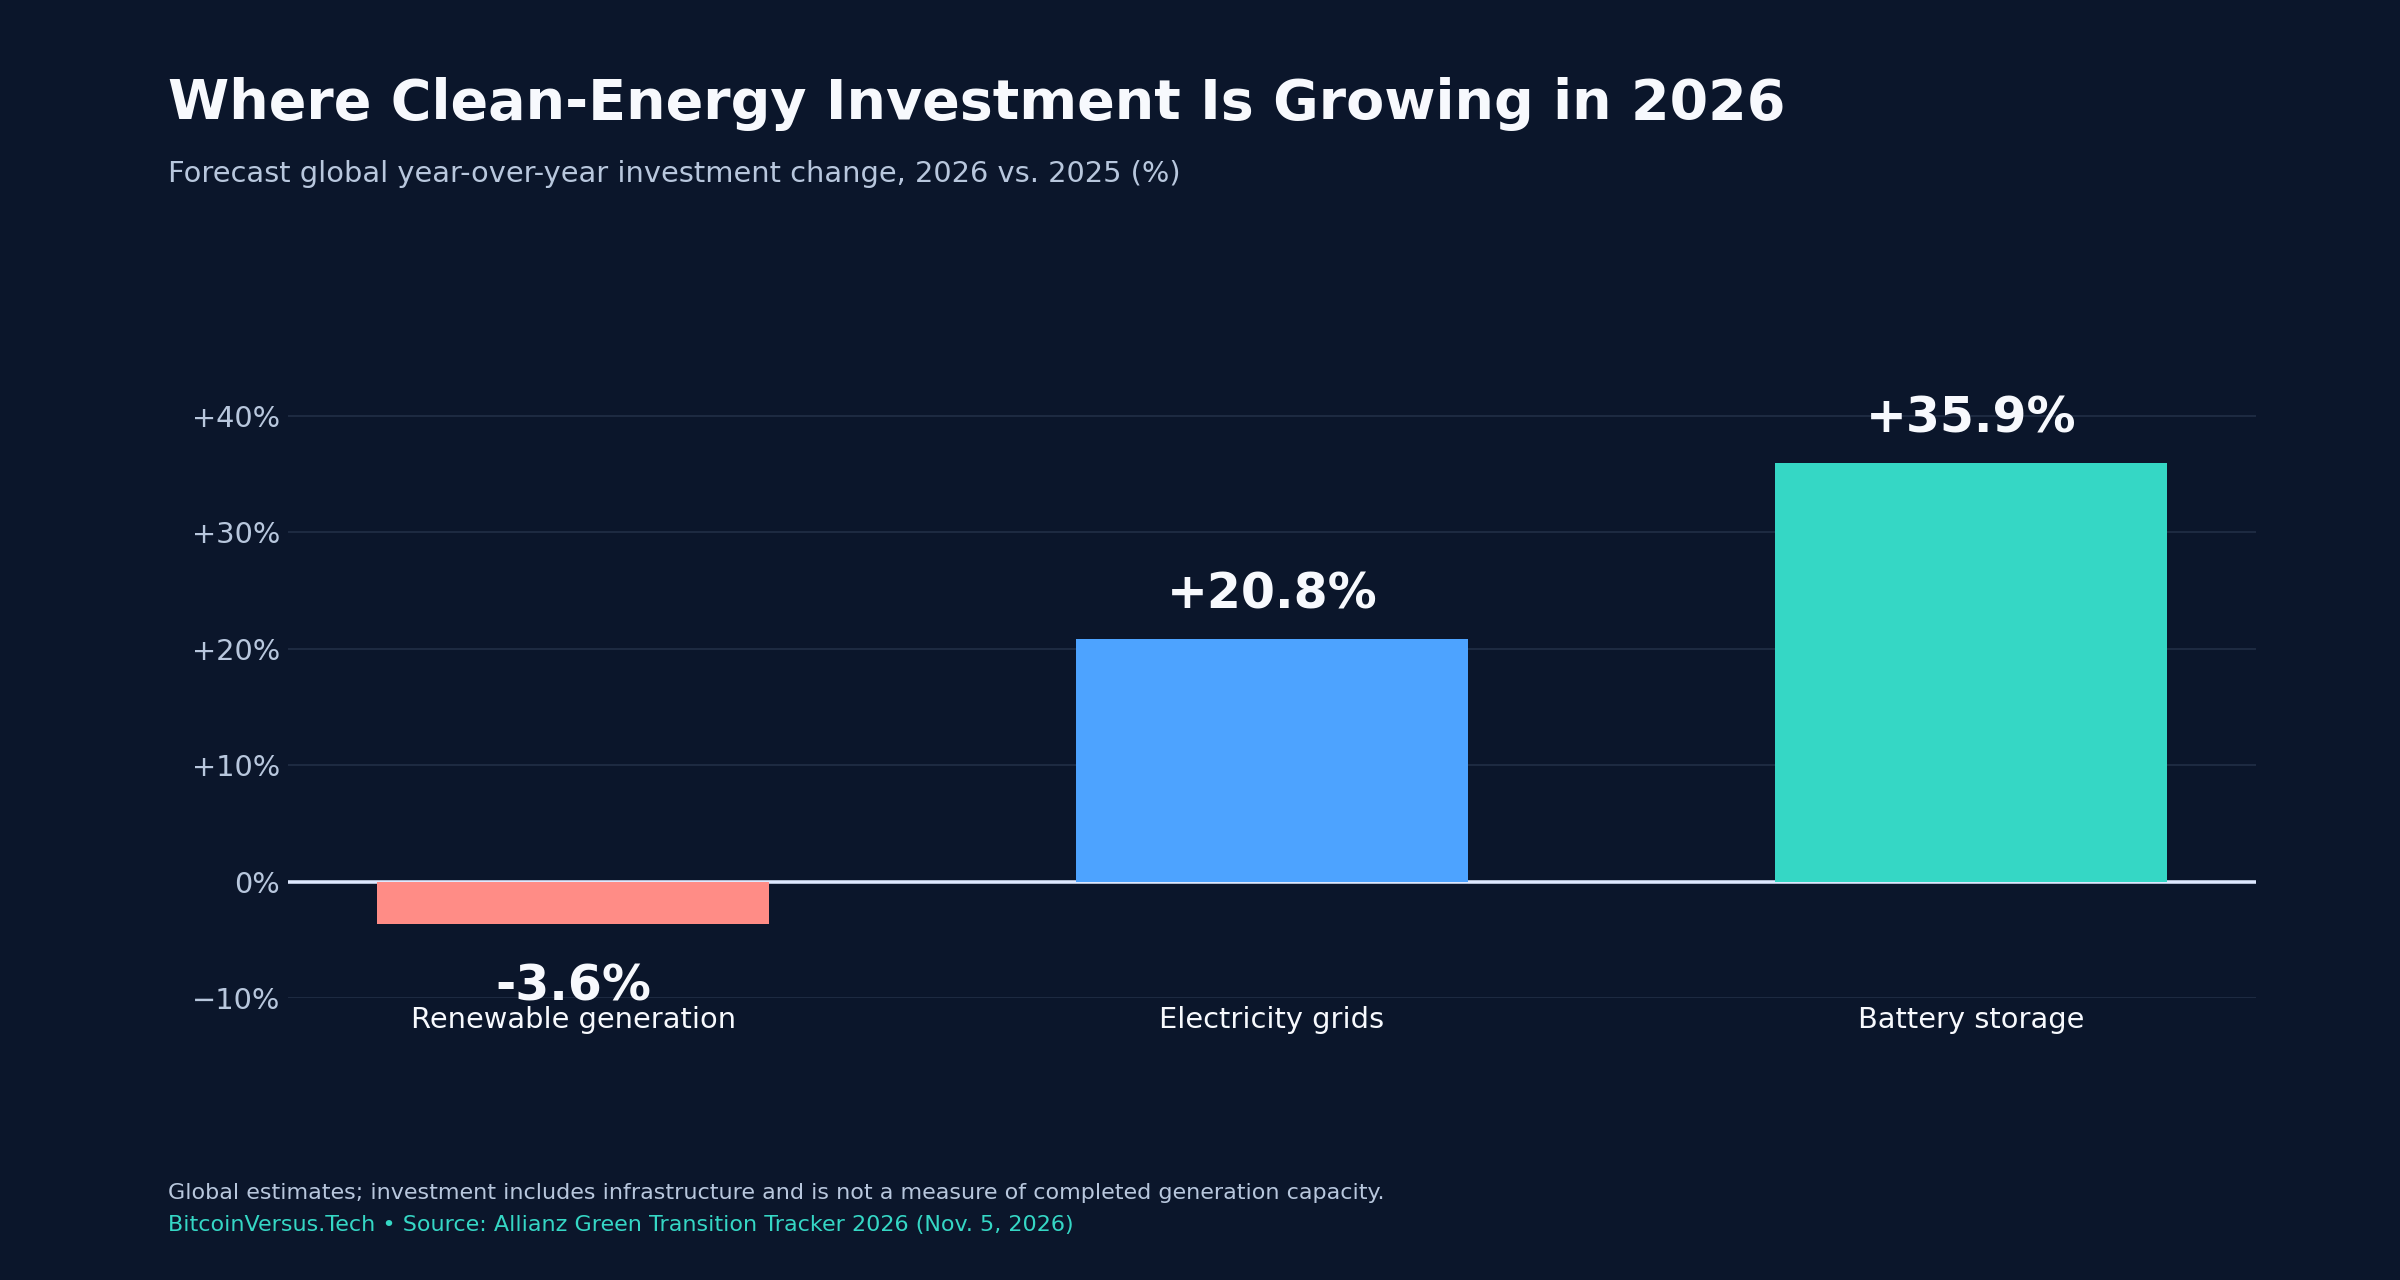
Allianz’s global outlook projects 20.8% growth in electricity-grid investment and 35.9% growth in battery-storage investment in 2026 compared with 2025. At the same time, renewable-generation investment is projected to fall 3.6%. All three are estimates for worldwide investment spending, not completed megawatts of infrastructure and not U.S.-only figures.
Electricity-grid projects often take longer to permit and build than the computing facilities or generation projects they support. Transmission constraints can keep new electricity supply from reaching load centers even when generating capacity exists. BitcoinVersus.Tech previously reported AEP’s $37 billion grid-expansion program and how solar, wind and batteries supported U.S. summer electricity demand. Those projects illustrate possible responses, but they do not validate the entire national forecast.
Battery additions have expanded dramatically
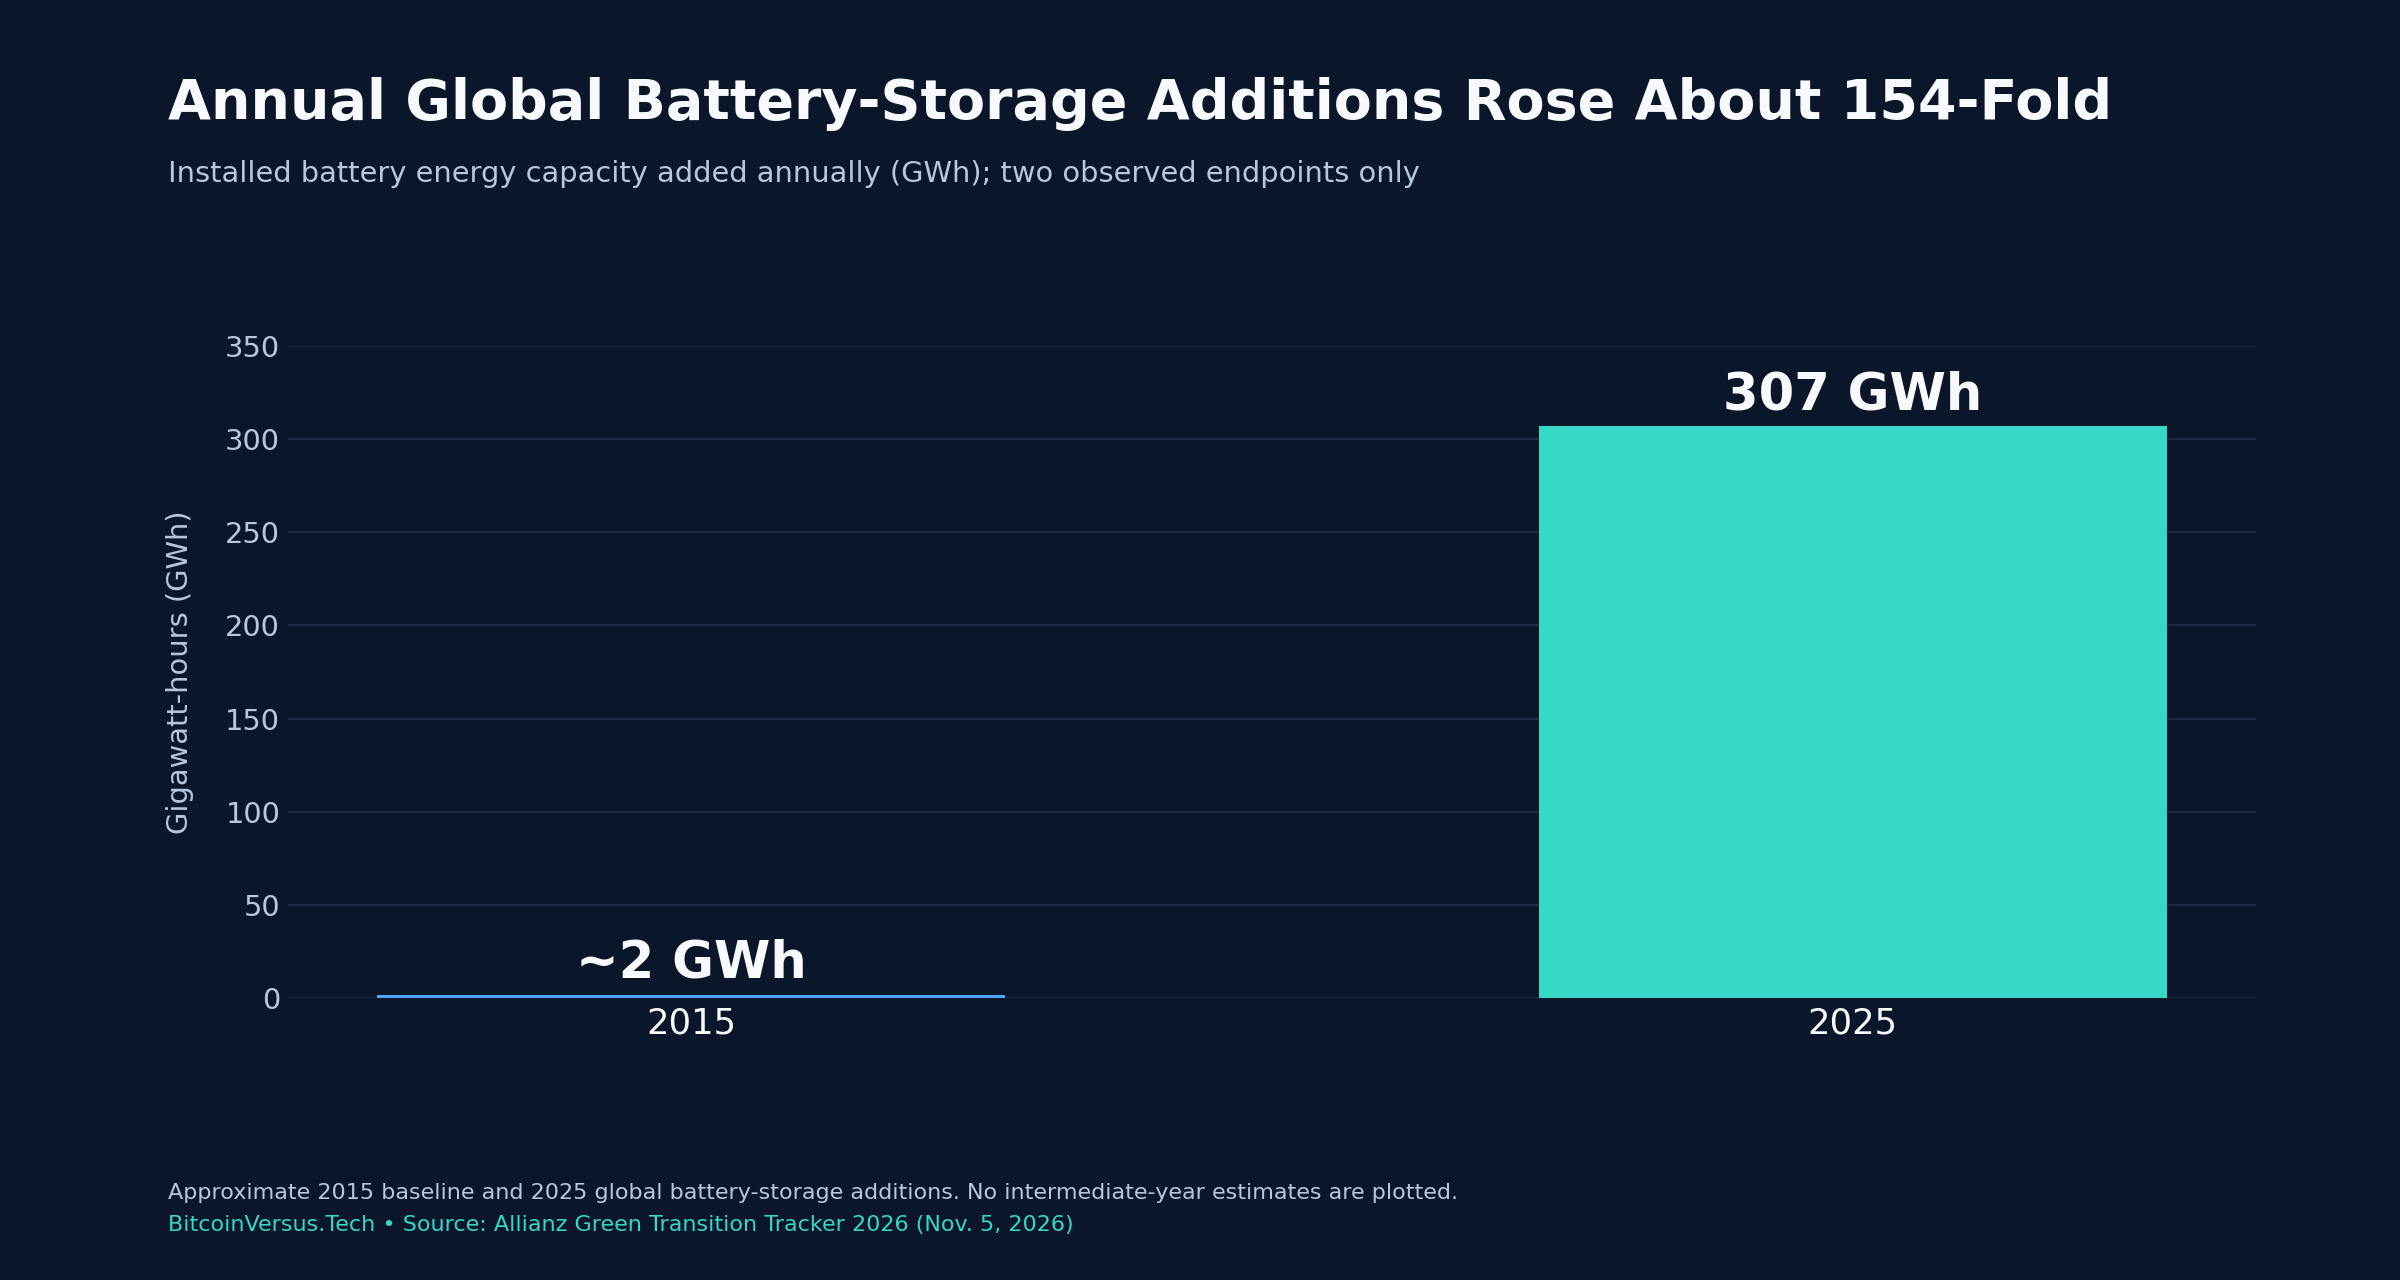
The Allianz study also estimates that annual worldwide battery-storage additions increased from approximately 2 GWh in 2015 to 307 GWh in 2025, roughly a 154-fold increase. The figure describes energy-storage capacity installed during each year, not the cumulative worldwide battery fleet or the electricity discharged by those batteries. The report estimates installed storage costs declined 91% over the period.
Storage can help shift electricity from high-generation periods to times of greater demand, but it cannot permanently replace generation or transmission. Output depends on discharge duration, charging conditions, maintenance and location. BitcoinVersus.Tech has separately ranked large operating U.S. battery installations. Generation technologies also vary: the site’s coverage of NTT DATA’s planned 900 MW fuel-cell agreement distinguishes planned power capacity from electricity already delivered.
A forecast, not a guaranteed outcome
The economic and environmental consequences depend on how quickly new demand materializes and whether utilities respond with low-carbon generation, grid upgrades or additional fossil-fuel output. More efficient chips and cooling could reduce electricity required per unit of computation while the total volume of computation still rises. Allianz’s 48% figure is a modeled scenario, not a measured 2030 outcome. Future revisions to data-center projects, utility interconnection queues and actual annual consumption will determine whether the forecast holds.
Editor’s Note: Statistical snapshot dated November 7, 2026. All original charts were checked against the November 5 Allianz Green Transition Tracker 2026: page 19 for the 35% historical share, projected 48% share and 210 TWh of additional U.S. demand; page 7 for 2026 projected global investment changes of −3.6%, +20.8% and +35.9%, plus approximately 2 GWh of annual battery additions in 2015 versus 307 GWh in 2025. The 154-fold approximation derives from 307 divided by approximately 2, and therefore is not an exact growth multiple. The EIA October Short-Term Energy Outlook offers broader demand context but does not independently confirm the Allianz scenario. Historical estimates, future forecasts, shares of incremental electricity demand, annual energy consumption, investment spending and storage capacity additions remain distinct measures. The featured illustration is conceptual and does not depict a named operating data center. No unverified video or social-media embed was inserted.

To donate 5,000 sats, open the article on a separate display and scan the original QR code with a compatible Bitcoin wallet. On mobile, use another screen or your wallet’s supported image-scanning feature. Verify the destination 3C9o19EH5HSiwEPyCTmEKzxhNCbo2X6TTb before sending.
We volunteer daily to ensure the information on this platform is Verifiably True. If you would like to support the research, please scan QR code.
BitcoinVersus.tech is not a financial advisor. Economic and technical statistics are provided for information; future forecasts depend on assumptions and may change.


Leave a Reply