Rust compiler contributors achieved a 2.85% average reduction in compilation wall time and 4.46% less peak memory across changes measured September 28 through November 2, 2026. In a November 4 engineering report, Nicholas Nethercote documented 236 significant benchmark improvements versus four regressions across 45 benchmark programs. The figures concern the monitored compiler performance suite, rather than a new stable release or a speedup guaranteed for every Rust application.
Rust’s rustc compiler converts code into intermediate representations, checks types and borrow rules, then generates machine code. Long builds affect local development, test feedback and continuous integration. BitcoinVersus.Tech’s Rust 1.99 coverage describes recent language development; compiler optimization has to preserve those features while controlling CPU and memory requirements.
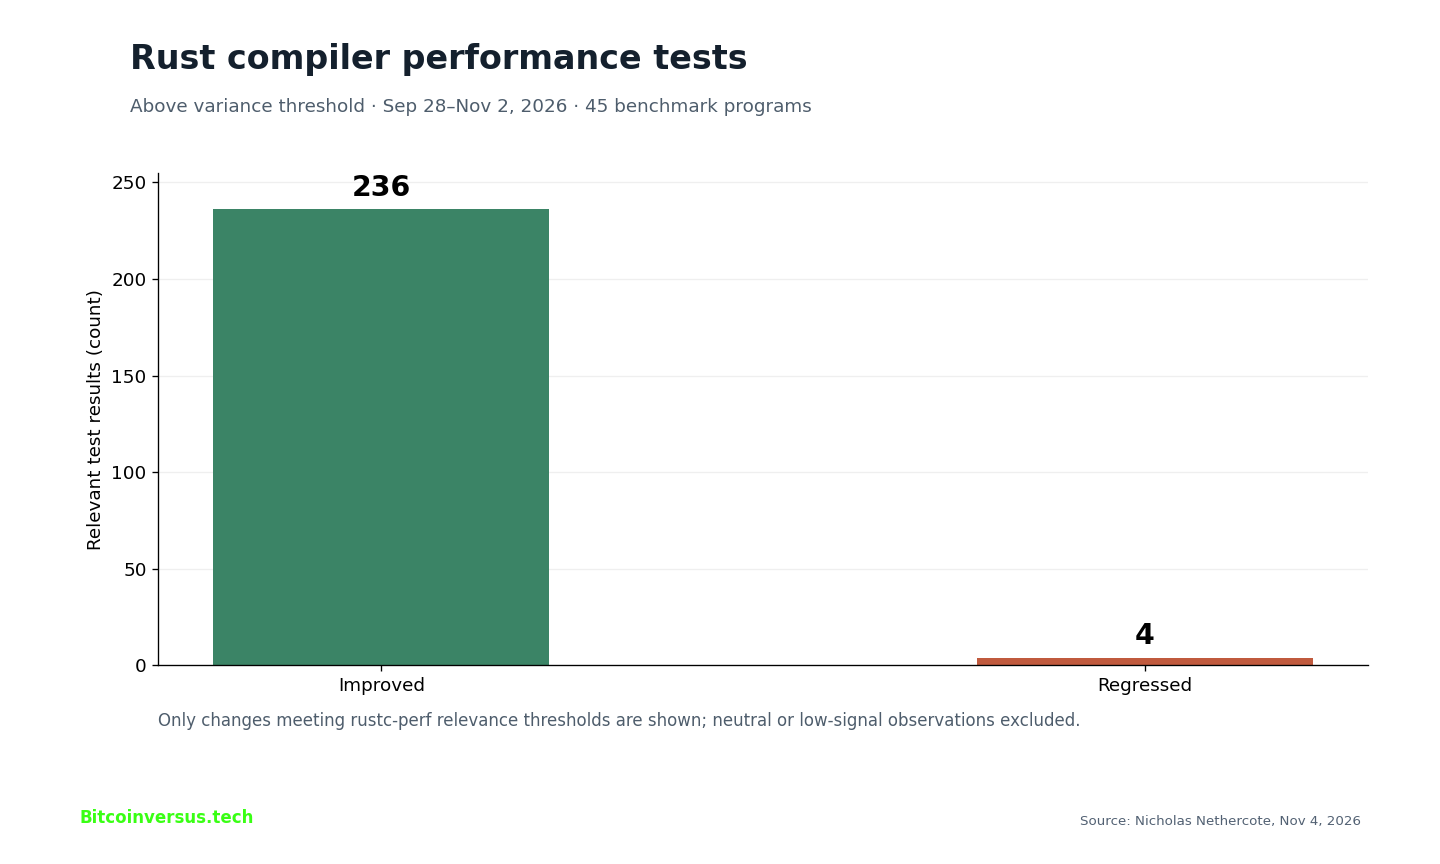
Significant improvements outnumber regressions
The official rustc-perf monitoring system identifies changes that exceed a relevance threshold intended to separate meaningful movement from measurement noise. Of 240 material increases or decreases, 236 improved and four regressed: approximately 98.3% favored faster compilation. Including results below the threshold changes the comparison to 599 improvements and 90 regressions. Neither ratio establishes performance for all programs, operating systems or machines.
A different, year-to-date comparison reported 560 instruction-count improvements out of 561 observations, with one regression. Unlike the five-week wall-time measurements, the instruction-count results extend back to the beginning of 2026. CPU instructions, processor cycles and actual elapsed time are not interchangeable, and cannot be combined into a single efficiency statistic.
Compact source spans reduce repetitive work
An optimization centered on source spans, which track code locations and macro context. A conventional span contains four 32-bit fields, totaling 16 bytes, while compact common cases use eight-byte encodings. Nethercote’s revised span representation reduced incremental-build interning to around 1% of spans, versus roughly 20%–40% before. Fewer table lookups helped lower instruction counts across multiple compiler benchmarks, especially incremental builds.
Several changes also reduced redundant operations in the in-development trait solver. On a full check of the Diesel crate, new-solver instruction-count overhead relative to the old solver fell from 49% to 16%. The comparison involves one workload and does not imply a universal trait-checking improvement. Other optimizations introduced a small cache for repeated parent-span queries and simplified token-stream processing.
Memory and elapsed time measure different gains
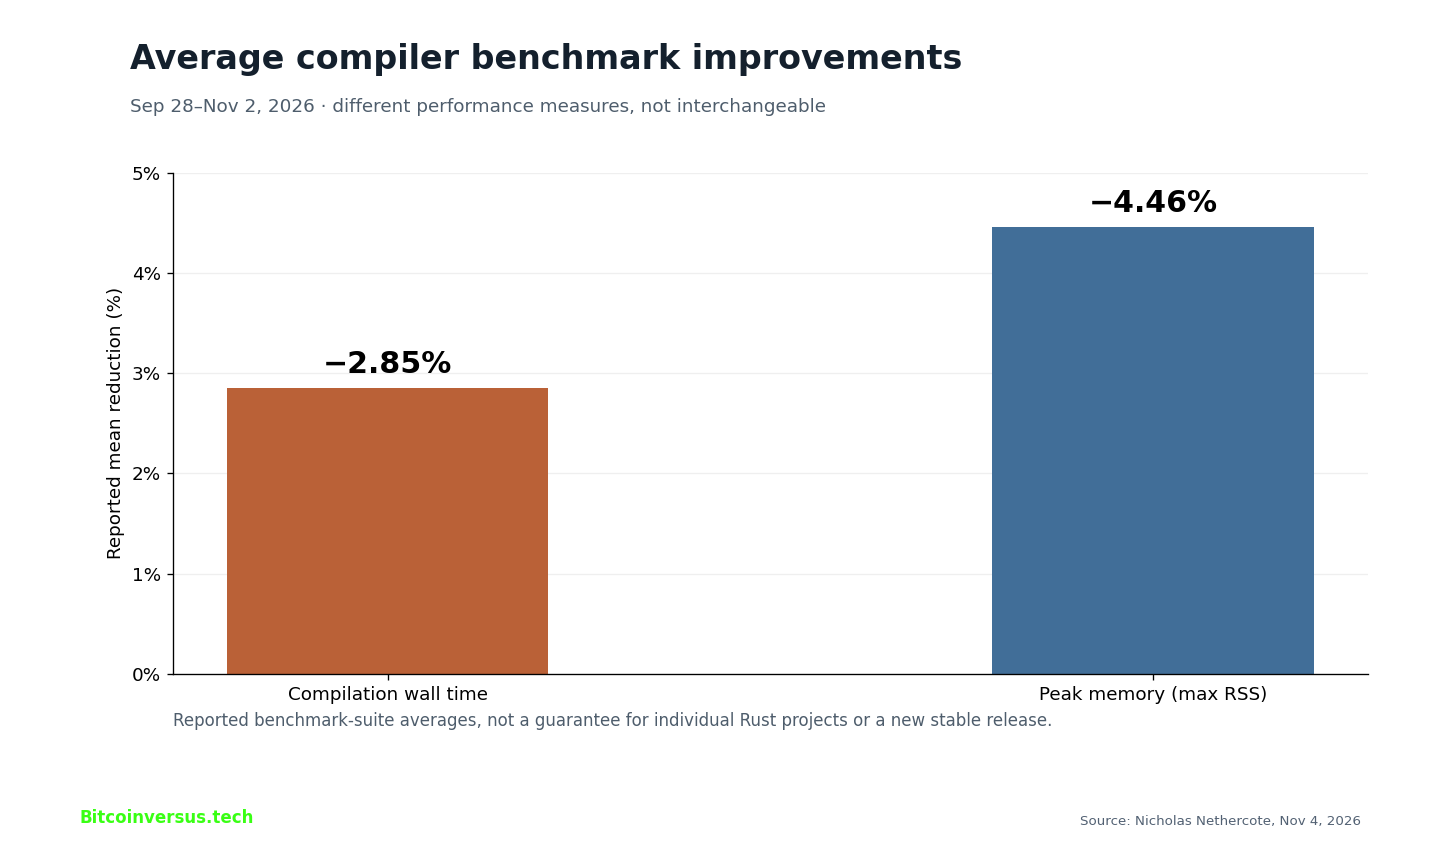
Nethercote reported average reductions of 2.85% in compilation wall time and 4.46% in peak resident-set size over the stated period. Adding those percentages would misrepresent the data. Another change using sparse metadata encoding cut some metadata sizes by up to 37% and peak memory by up to 7%, with little overall elapsed-time change.
The lesson extends across software engineering: better memory layouts, fewer allocations and less recomputation can improve performance without altering application code. Earlier coverage of LZ4 benchmark scaling, native TypeScript compiler testing and Rust-based TypeScript compiler work illustrates distinct performance tradeoffs.
Rust’s 2025 developer survey shows that incremental rebuilds, type-checking and clean CI builds cause different frustrations. Representative workstation testing must therefore hold hardware, compiler revision, target profile, cache state and project dependencies constant. Gains within rustc-perf are substantive engineering evidence, but not proof of faster builds for every commercial workload.
Primary sources: Nicholas Nethercote, November 4, 2026; Rust compiler performance collector; Rust performance dashboard.
Editor’s Note: Figures come from Rust compiler engineer Nicholas Nethercote’s November 4, 2026 performance report. Five-week benchmark averages and year-to-date instruction-count changes use different observation windows. Measurements are not guarantees for individual Rust projects or proof of inclusion in a particular stable release. The featured cover is conceptual, and original charts reproduce the reported figures. No independent replication or video playback is claimed.
Support BitcoinVersus.Tech
To support independent reporting, use the original approved 5,000-satoshi QR below. Mobile users can open the story on a second device to scan with a Bitcoin wallet, or use a supported scan-from-image function. Verify the recipient and amount before paying.

We volunteer daily to ensure the information on this platform is Verifiably True. If you would like to support the research, please scan QR code.


Leave a Reply