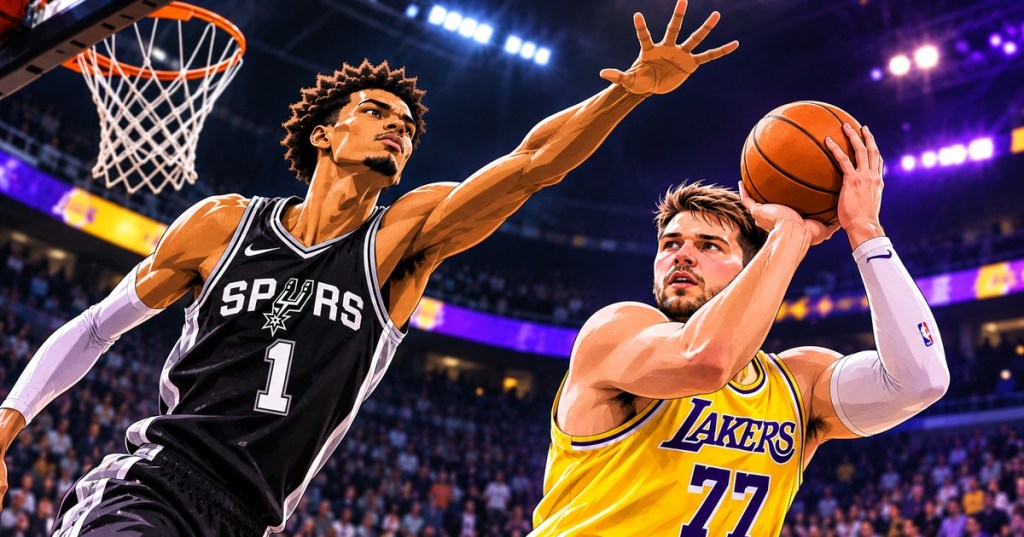
As of November 7, 2026, Luka Dončić has the overwhelming scoring advantage in the early NBA MVP comparison. Victor Wembanyama owns the rebounding and shot-blocking edge. A five-metric chart study illustrates why each star has a distinct path toward the league’s highest individual award.
The original BitcoinVersus.Tech MVP scouting report examined how elite defense could offset historic offense. The numerical follow-up measures the three defining strengths for each candidate: Wembanyama’s points, rebounds and blocks; Dončić’s points, assists and made three-pointers.
The sample contains 10 Spurs games for Wembanyama and nine Lakers games for Dončić, according to 2026–27 NBA game records cross-checked against Dončić’s and Wembanyama’s game logs. Totals are divided by games played, not by team games or minutes. The figures are observed early-season averages, not forecasts.
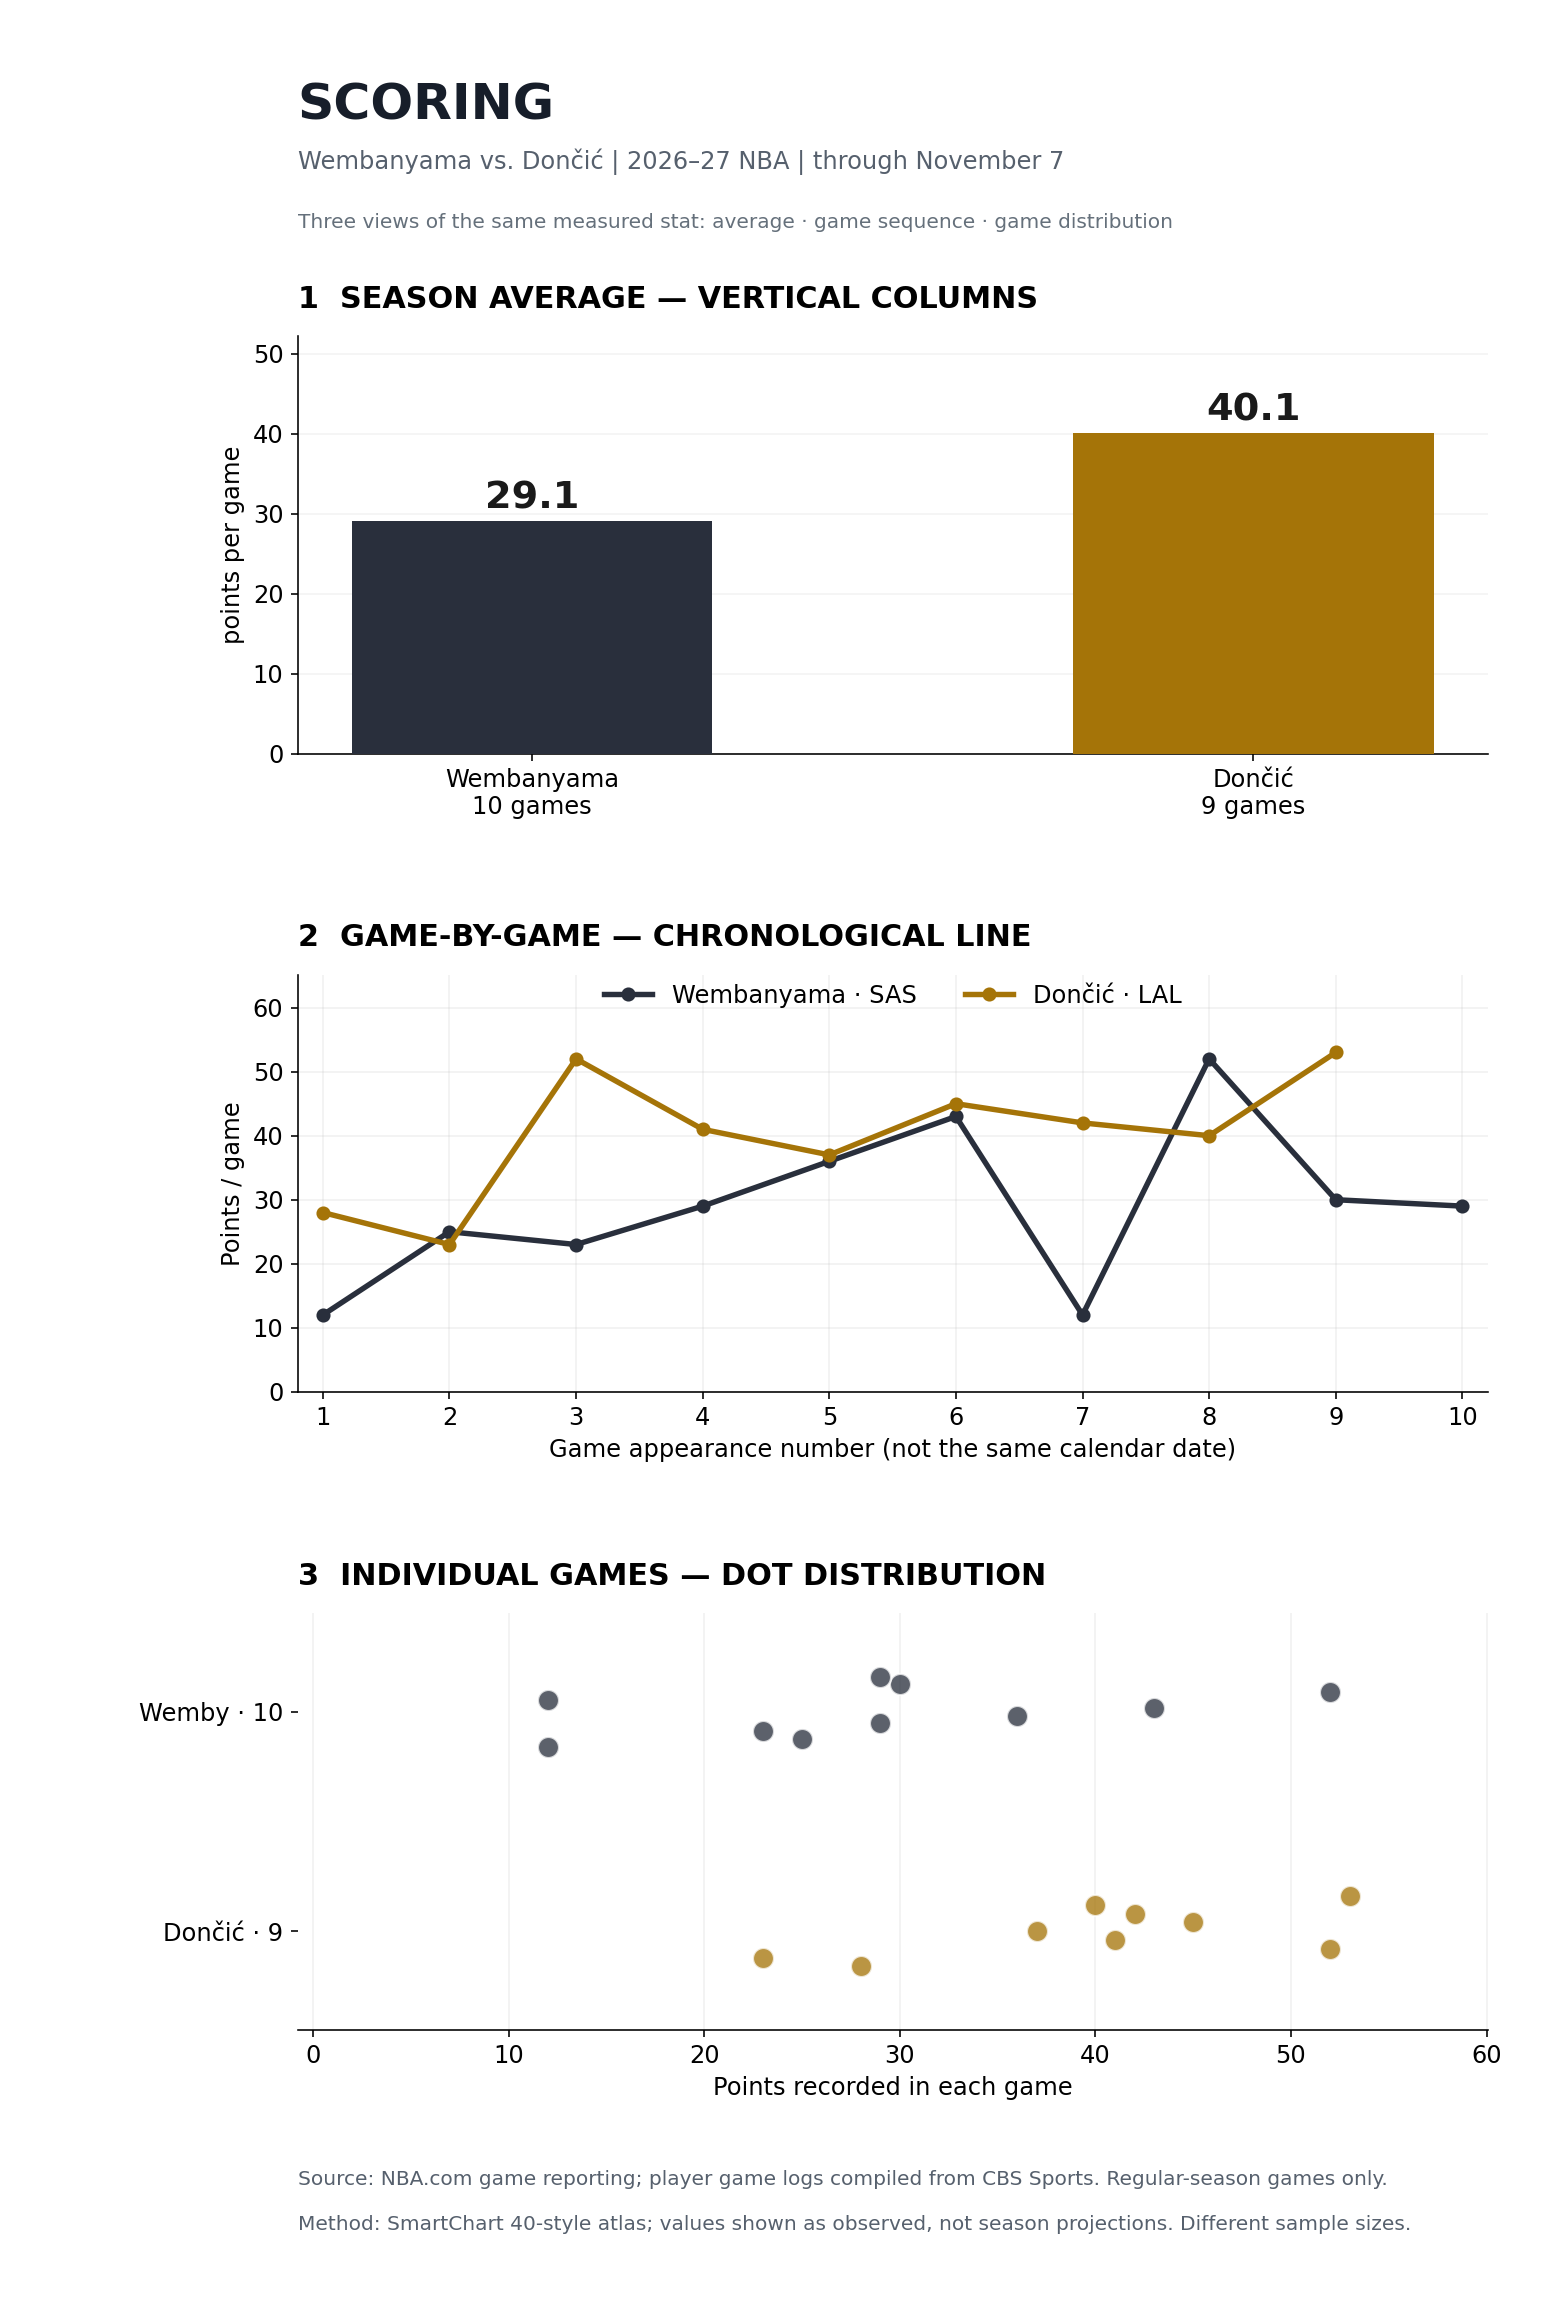
Scoring — 40.1 versus 29.1 points per game
Dončić recorded 361 points in nine games, averaging 40.1. Wembanyama scored 291 across ten games, averaging 29.1. The gap is 11.0 points per game; Dončić’s output is roughly 38% higher relative to Wembanyama’s average. Both have shown high peaks: 53 for Dončić against Portland on November 6 and 52 for Wembanyama against Dallas on November 4.
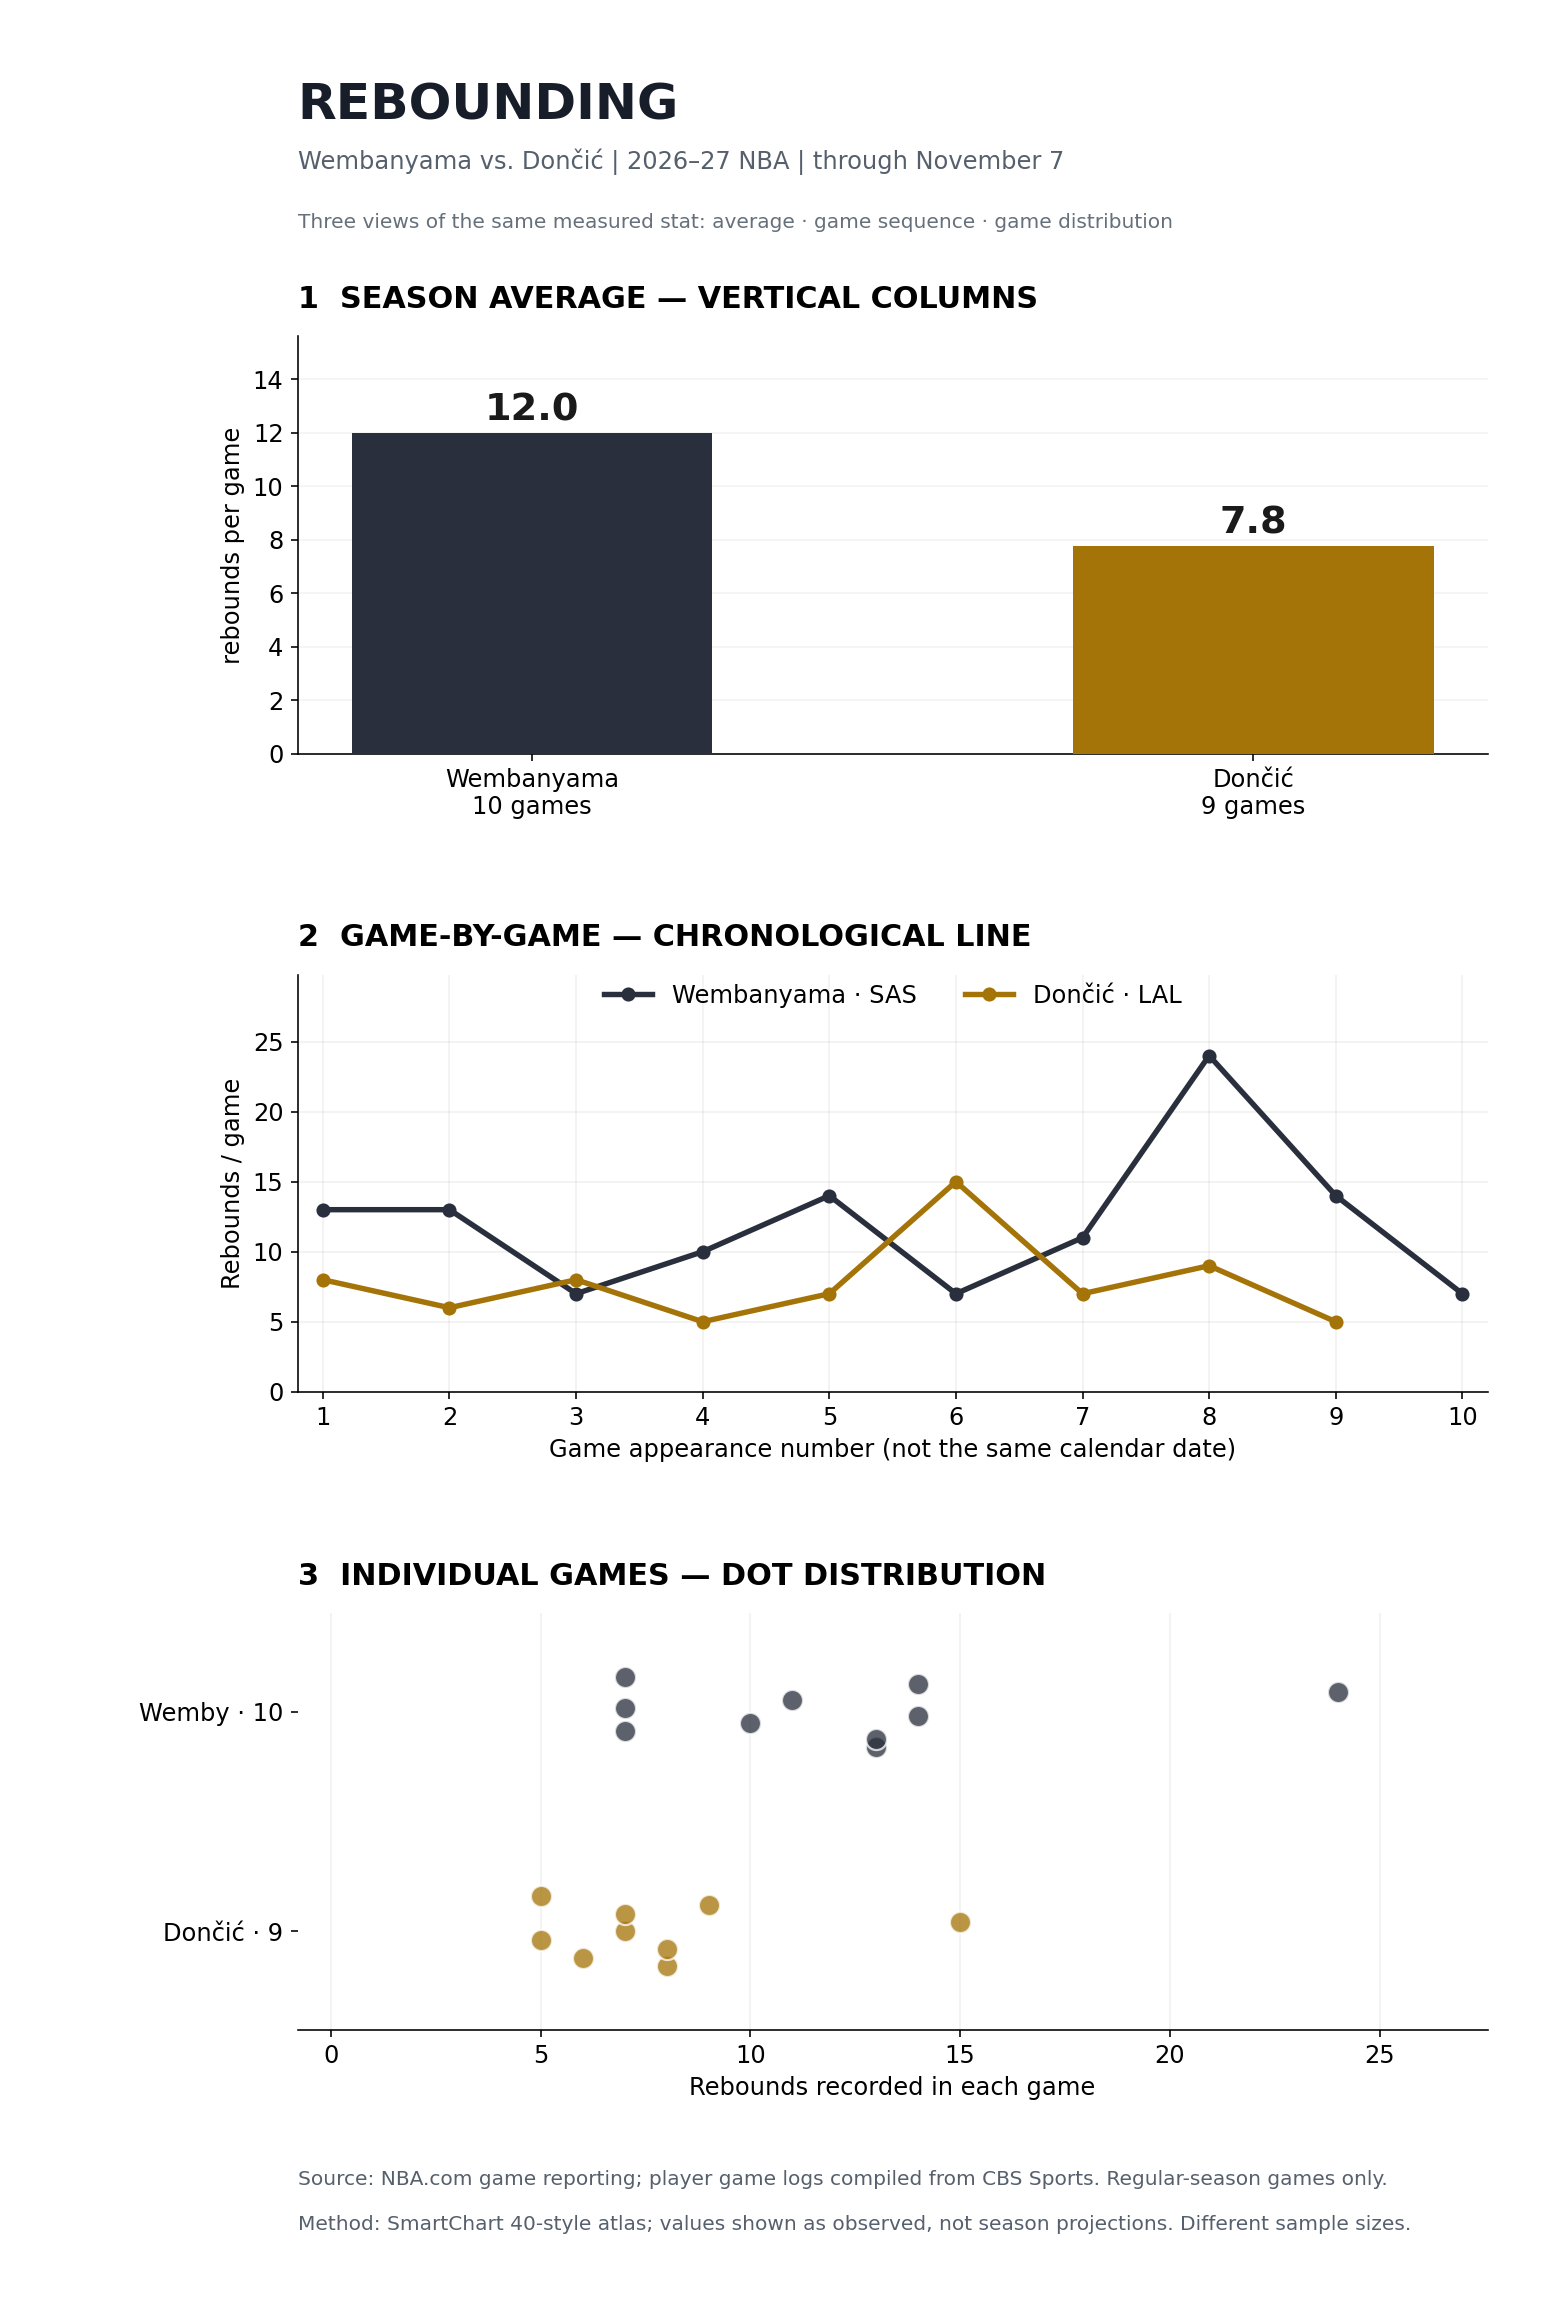
Wembanyama’s second edge — 12.0 rebounds per game
Wembanyama collected 120 rebounds in ten appearances, compared with Dončić’s 70 in nine, or 12.0 versus 7.8 per game. The 4.2-rebound difference matters because controlled defensive rebounds terminate possessions, while offensive boards can create additional attempts. The distribution also captures Wembanyama’s 24-rebound performance against Dallas.
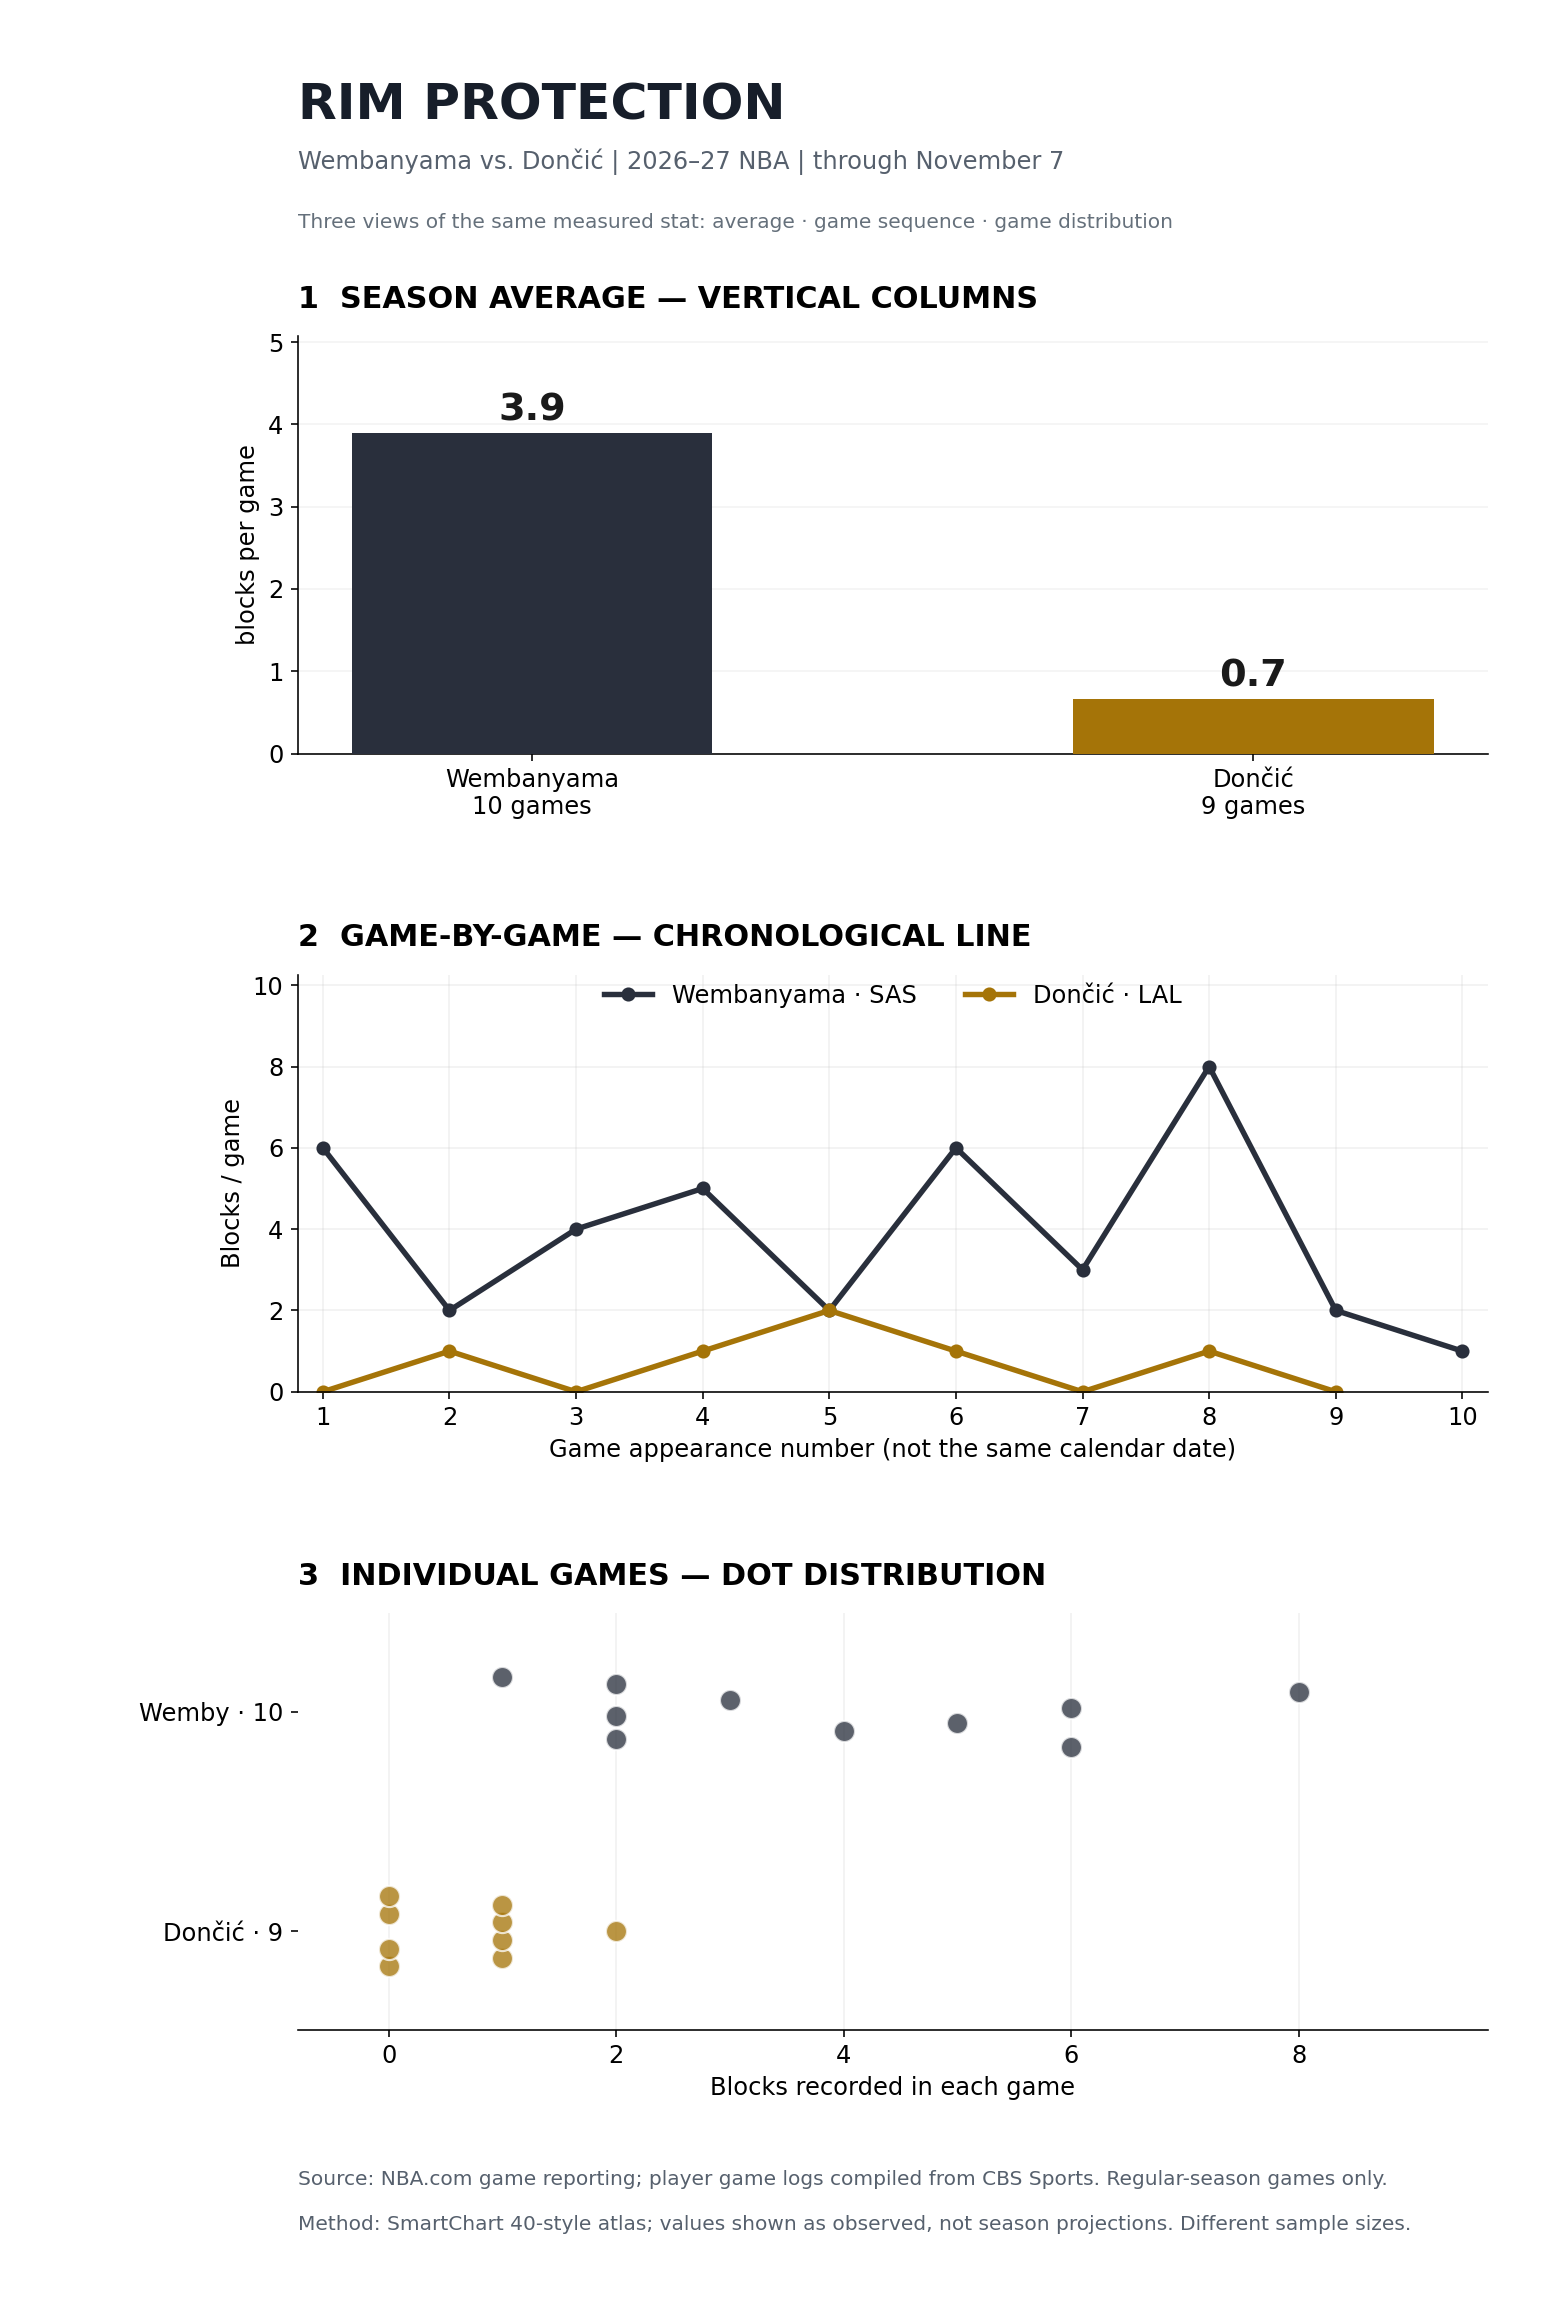
The defensive separator — 3.9 versus 0.7 blocks
Wembanyama logged 39 blocks in ten games, averaging 3.9. Dončić recorded six in nine games, or 0.7 when rounded. Blocks are not a comprehensive defensive valuation: positioning, deterrence, switches, opponent efficiency and team schemes also matter. The nearly sixfold gap nonetheless captures a measurable part of Wembanyama’s rim-protection advantage.
Wembanyama’s 52-point, eight-block Dallas performance. Source: NBA YouTube highlights; live playback not independently confirmed.
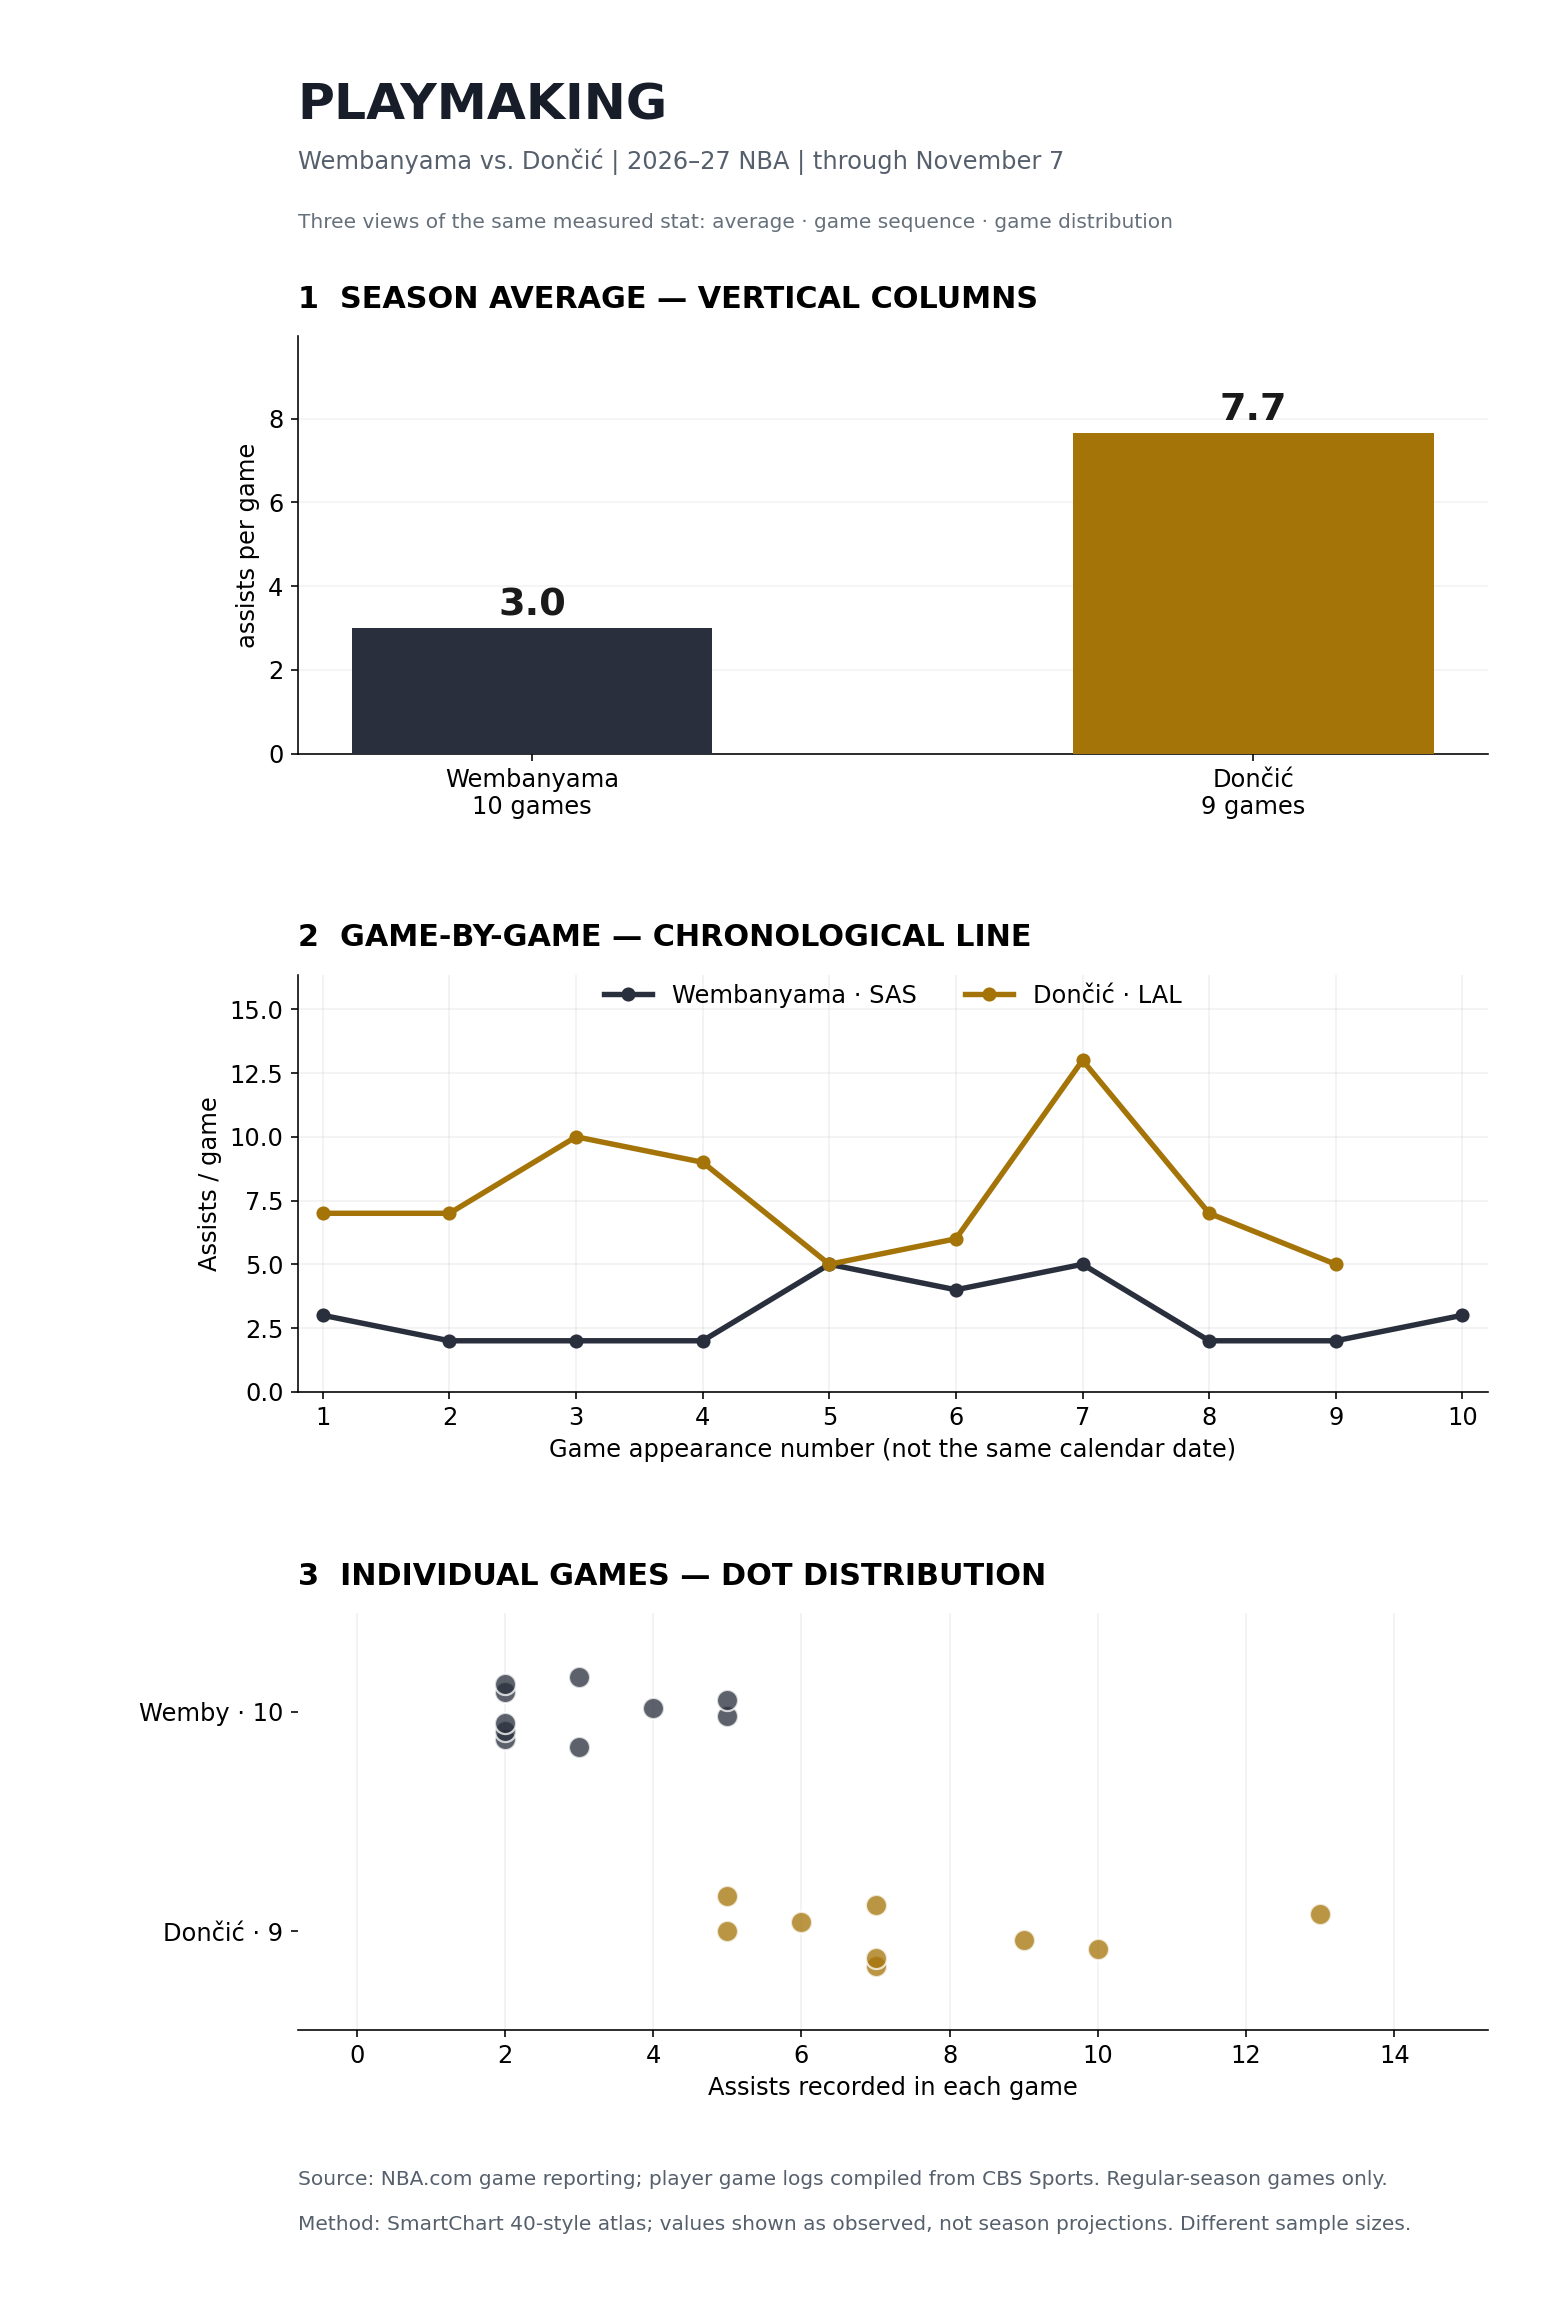
Dončić’s creation edge — 7.7 assists per game
Dončić delivered 69 assists over nine games, averaging 7.7. Wembanyama supplied 30 across ten, or 3.0. The difference reflects role as well as skill: the Lakers run far more primary creation through Dončić, while San Antonio uses its center as a finisher, screener and spacing threat.
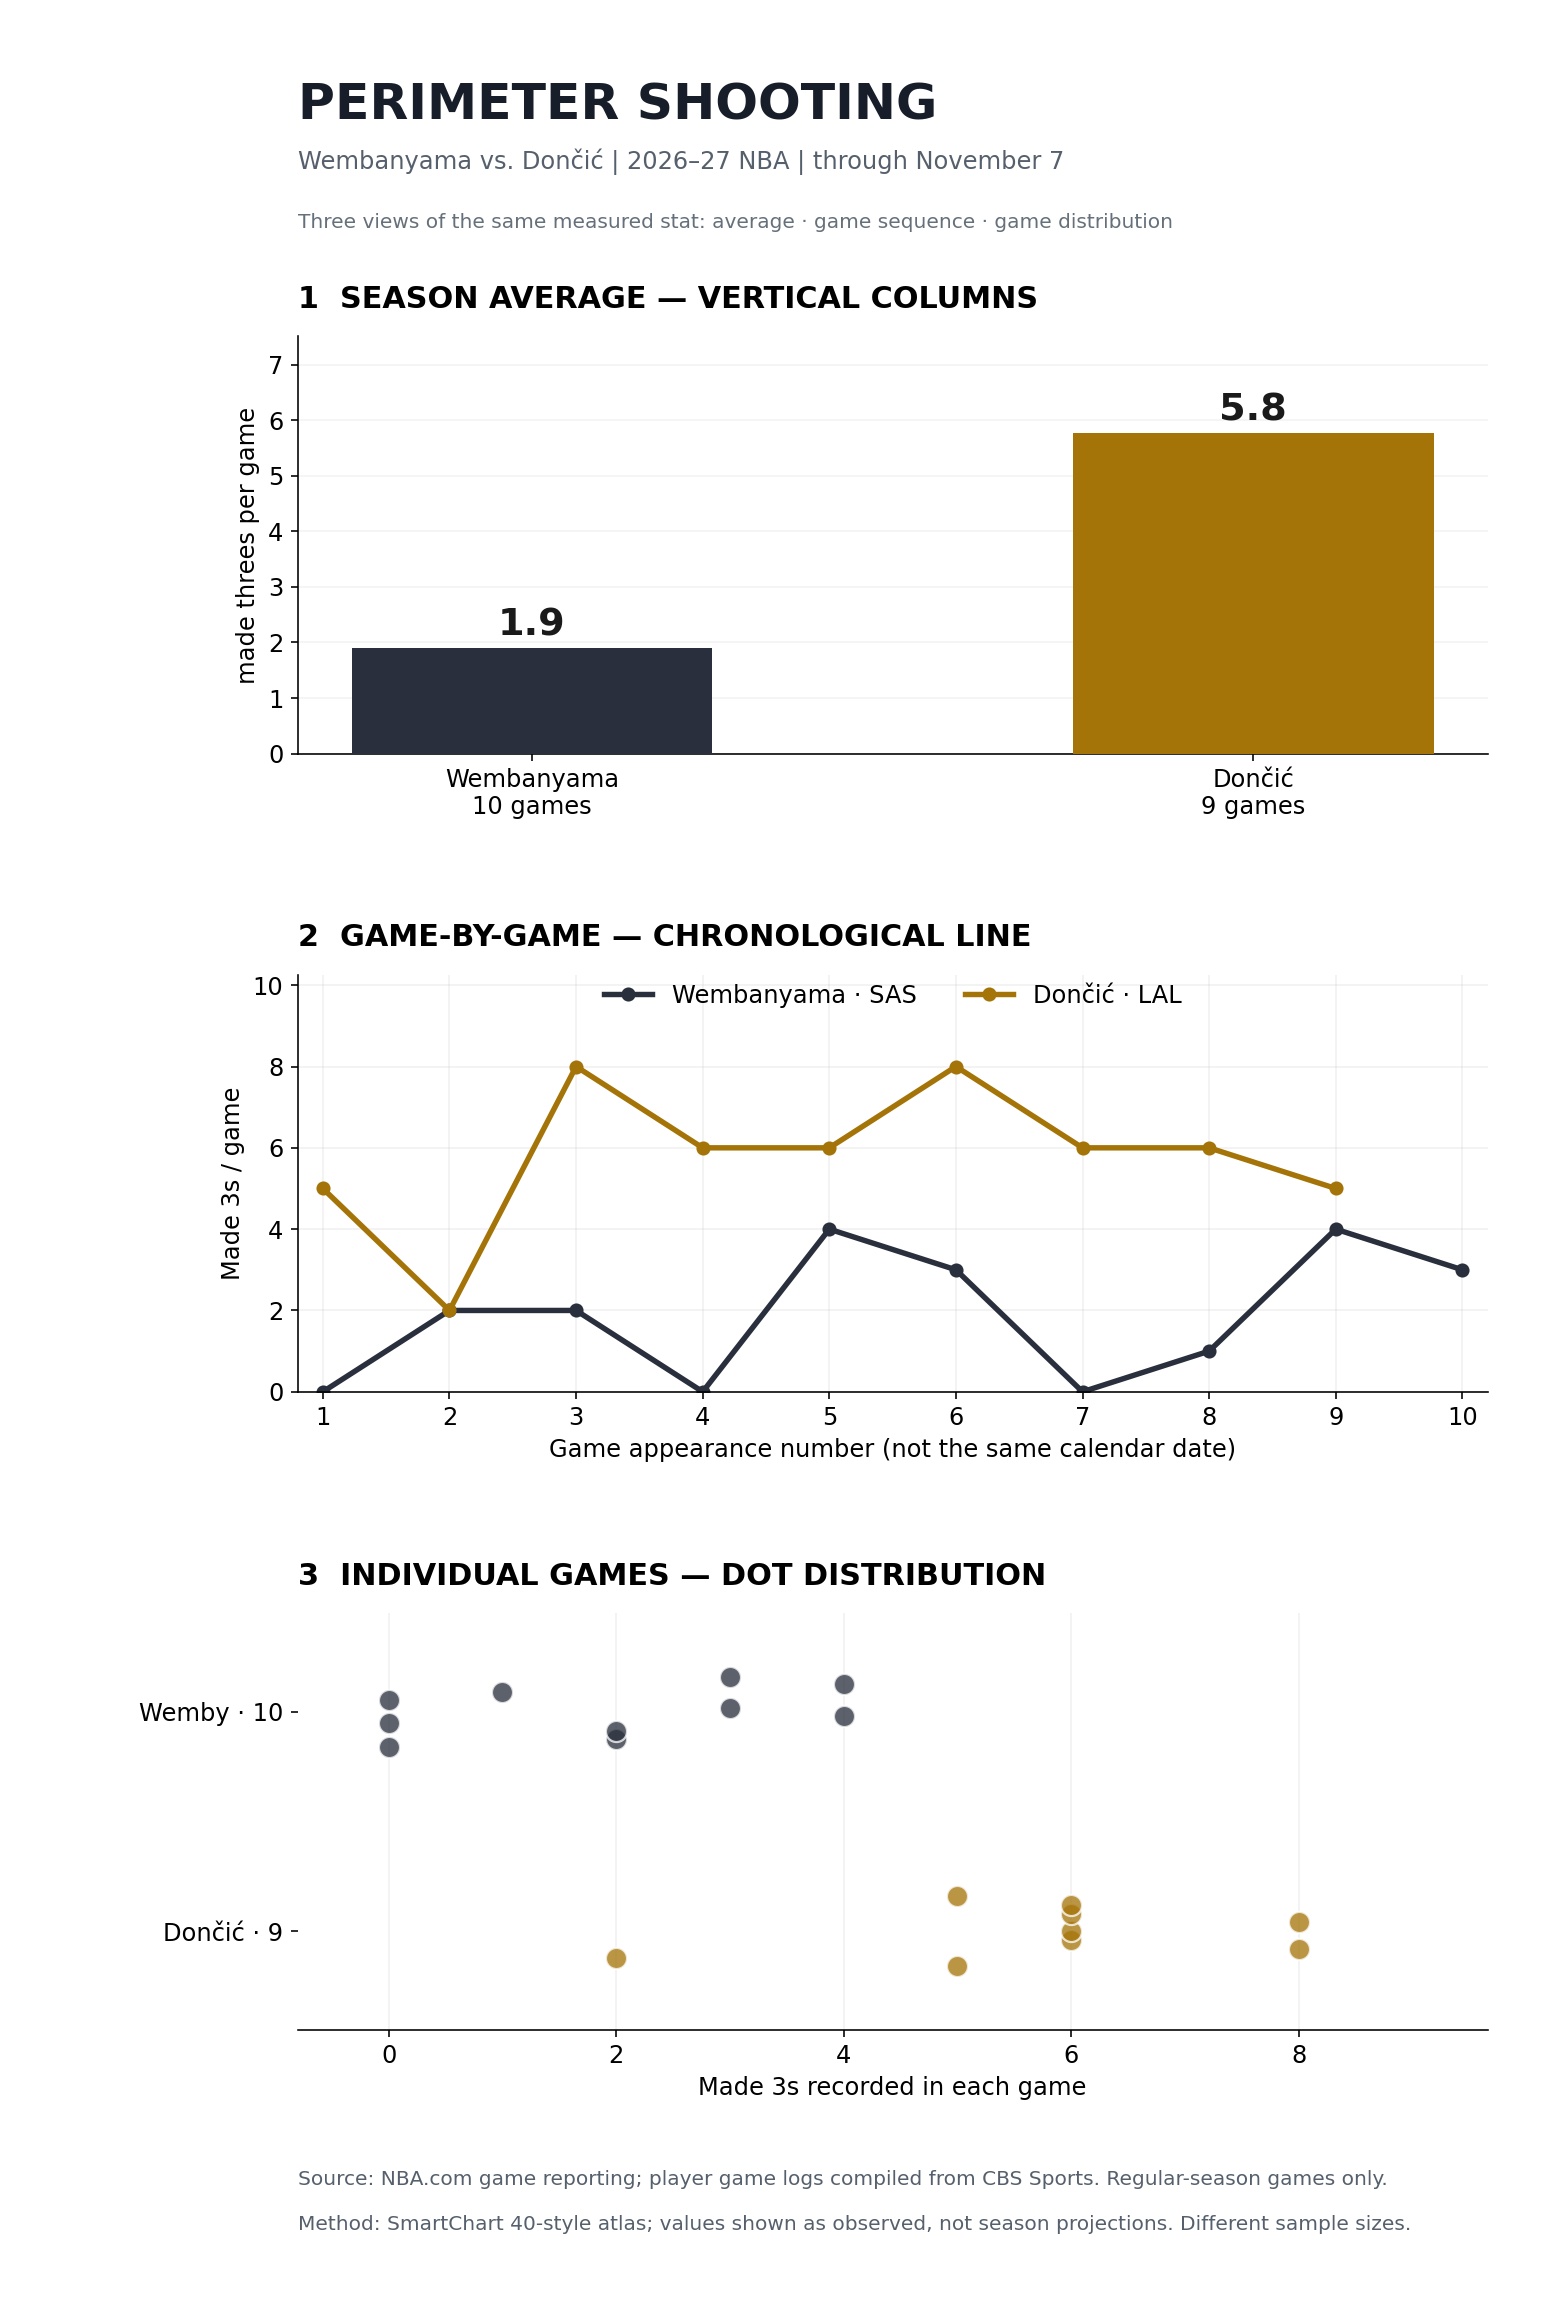
The three-point weapon — 5.8 versus 1.9 made threes
Dončić made 52 three-pointers in nine games, averaging 5.8. Wembanyama made 19 in ten, averaging 1.9. Dončić’s pull-up volume changes how far defenders must guard the ball and creates passing windows. The made-three comparison measures output, not shot difficulty or efficiency; attempts and percentages require separate treatment.
Dončić’s 53-point Portland highlights. Source: NBA YouTube highlights; live playback not independently confirmed.
Why three chart views matter
The SmartChart 40-style atlas was reviewed for each metric. Zero-based vertical columns communicate the size of the average. Chronological lines expose changes across each player’s appearances, not shared calendar dates. Individual-game dot plots show consistency and outliers. Grouped bars and lollipop charts were viable alternatives; stacked areas and radar charts would imply inappropriate additivity or comparable scales.
For a wider NBA perspective, read BitcoinVersus.Tech’s Top 25 NBA Players, its Wembanyama defensive-sequence analysis, and its reporting on NBA smart-ball technology.
Verdict: Dončić leads the offensive-volume case through the stated cutoff. Wembanyama’s claim rests on elite scoring paired with substantially more rebounding and measurable rim protection. Neither five charts nor a ten-game sample can settle an 82-game MVP race; team success, efficiency, health and lineup-adjusted impact remain essential.
Editor’s Note
Statistics reflect NBA regular-season games played through November 7, 2026. Wembanyama has ten appearances; Dončić has nine. The three chart methods reuse the same source observations and must not be interpreted as independent datasets. Editorial analysis is not an official NBA award prediction.
Support BitcoinVersus.Tech
To support independent technology and sports reporting, scan the original donation QR for an optional 5,000-satoshi contribution. On mobile, display the code on another device or use your compatible wallet’s image-scanning feature. Verify the address and amount before confirming.

We volunteer daily to ensure the information on this platform is Verifiably True. If you would like to support the research, please scan QR code.


Leave a Reply