Three-point percentage measures successful shots from beyond the NBA’s three-point arc divided by attempts from the same distance. The calculation is straightforward, but a leaderboard needs a minimum number of made shots to prevent a player who goes one-for-one from being treated as the most accurate shooter in the league.
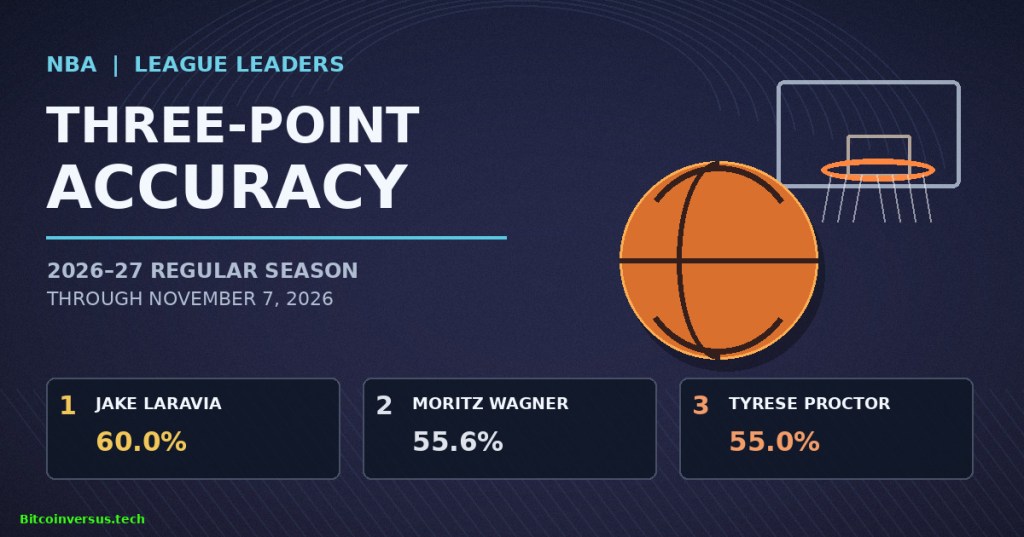
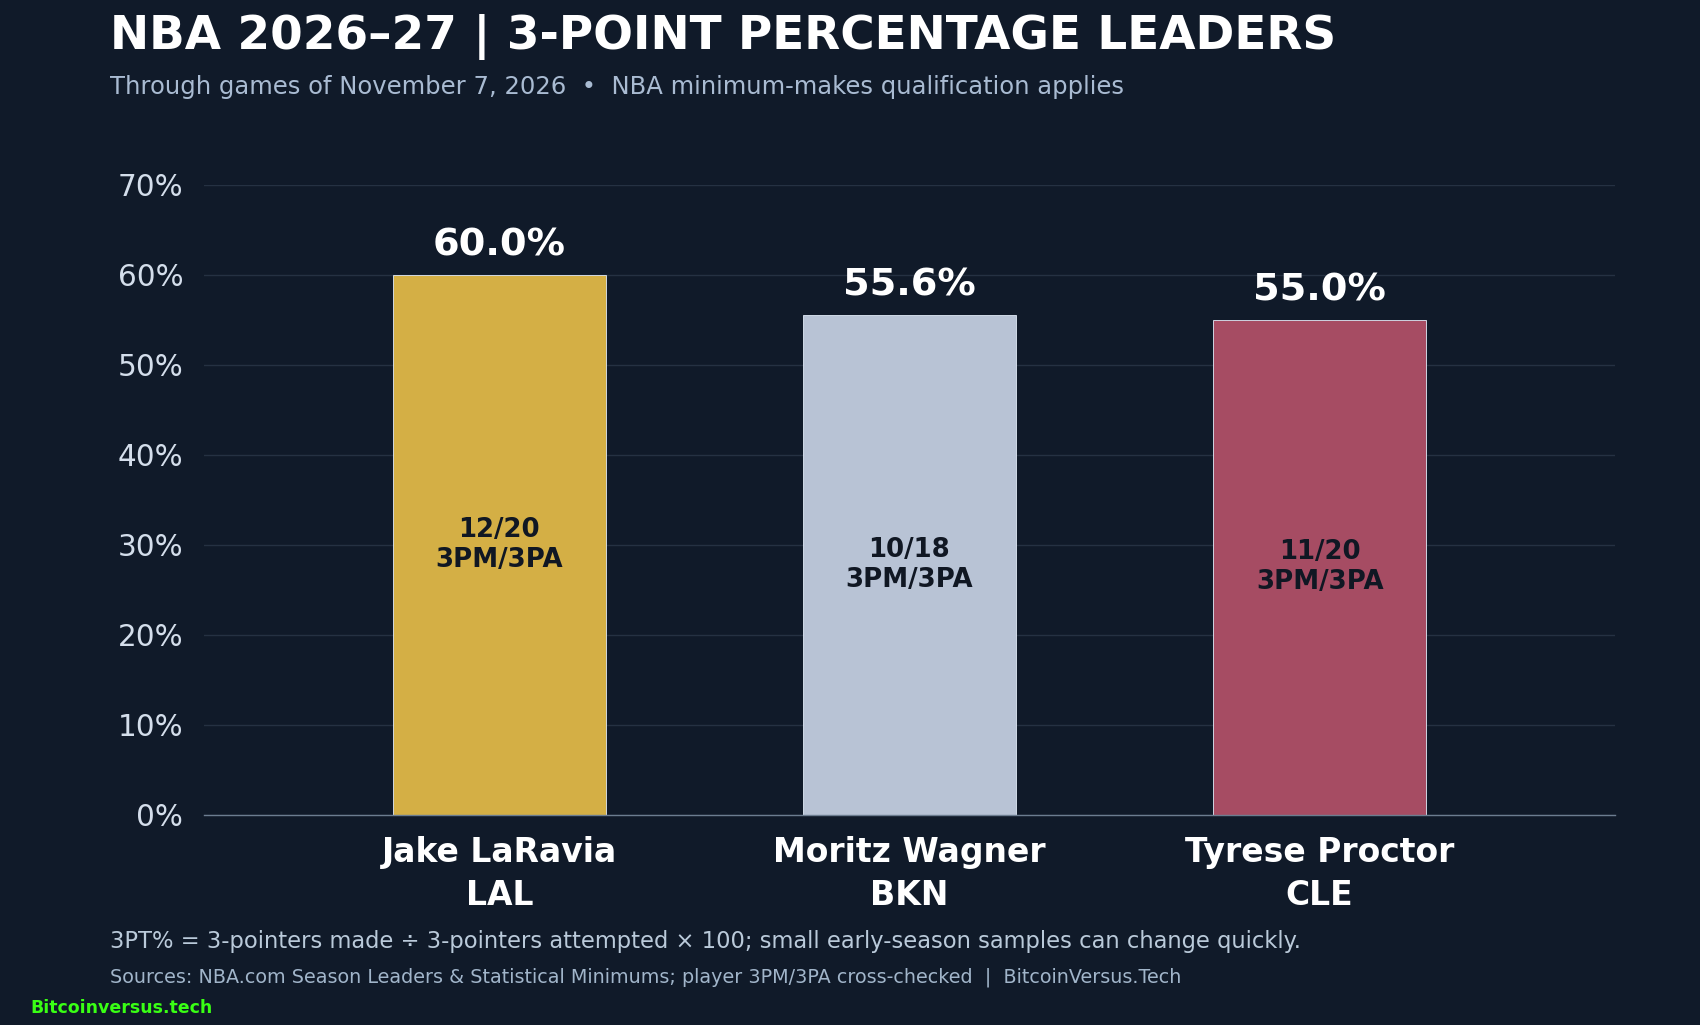
Through completed games on November 7, 2026, the NBA’s 2026–27 season-leaders page ranked Los Angeles Lakers forward Jake LaRavia first at 60.0% (12-for-20), Brooklyn Nets center Moritz Wagner second at 55.6% (10-for-18) and Cleveland Cavaliers guard Tyrese Proctor third at 55.0% (11-for-20). The individual make-attempt counts are corroborated by the dated statistics snapshot.
Jake LaRavia leads at 60.0%
LaRavia has converted 12 of 20 three-point attempts in nine games, a very efficient opening stretch. Yet the sample represents only 2.2 attempts per appearance. His 2025–26 season rate was 32.1% on 78 makes in 243 attempts, illustrating why a hot first few weeks should not be projected automatically across 82 games.
Jake LaRavia scored 27 points and made five of six three-pointers in the Lakers–Timberwolves game on October 29, 2025. Historical game highlights, not footage from the November 2026 leaderboard period. Credit: NBA official YouTube channel.
Moritz Wagner follows at 55.6%
Wagner, now with Brooklyn, has made 10 of 18 shots from deep. His 55.6% trails LaRavia by roughly 4.4 percentage points, although the difference is just two made shots between their small early-season totals. The German forward-center supplies perimeter spacing from a role that also involves screening and finishing around the basket.
NBA Europe introduces Moritz Wagner to Brooklyn fans with a compilation of plays from his Orlando Magic tenure, published July 12, 2026. Archival NBA footage; not evidence of his November three-point totals. Credit: NBA Europe/YouTube.
Tyrese Proctor ranks third at 55.0%
Cleveland’s Proctor has made 11 of 20 three-point tries in nine games. The Australian guard is only 0.6 percentage points behind Wagner, despite having one more make on two additional attempts. Such narrow margins make the order particularly susceptible to one shooting night.
The Cleveland Cavaliers’ verified YouTube channel highlights Proctor’s April 12, 2026 game against Washington, when he recorded 22 points, 11 rebounds and eight assists. Earlier-season footage, not an illustration of the November 7 percentage sample. Credit: Cleveland Cavaliers/YouTube.
The math shows why the ranking can change
A single hypothetical missed three would reduce LaRavia’s percentage from 60.0% to 12-for-21, or 57.1%. Wagner would move to 10-for-19, or 52.6%, and Proctor to 11-for-21, or 52.4%. Those scenarios change the denominator, not the players’ recorded totals. Percentage-point differences should not be described as percentage changes in shot volume.
NBA eligibility uses made shots, not an arbitrary attempt floor
The NBA’s statistical-minimum rules require 82 made three-pointers across a full 82-game season, with a prorated minimum during the schedule. The displayed leaders satisfy the league’s current qualification rule; the rankings are a dated snapshot, not the final 2026–27 shooting title.
Volume and efficiency answer different questions. A player can lead in three-pointers made without leading in percentage. Earlier BitcoinVersus.Tech comparisons of Tyrese Maxey and Stephen Curry and Harden and Dončić scoring peaks measured scoring production instead of the proportion of long-range attempts converted.
Likewise, the site’s Wembanyama–Dončić statistical assessment and quintuple-double scouting analysis illustrate how categories must be interpreted according to their own definitions. For three-point accuracy, the clearest ongoing evidence will be season makes, attempts, eligible status and how the percentage holds as the sample grows.
Sources and methodology
NBA.com official season leaders (checked November 8, cutoff through November 7); NBA statistical minimums; 2026–27 3PT% leaderboard and make-attempt totals; LaRavia NBA player profile; Wagner NBA profile; Proctor NBA profile. Percentages calculated as 100 × made threes ÷ attempted threes; values rounded to one decimal place.
Editor’s Note: All three shooting percentages are early regular-season figures through November 7, 2026, not final-season performance or shooting forecasts. NBA qualification thresholds are prorated during the season. All three YouTube videos are verified archival player-related NBA or team footage, and none is represented as documentation of November 2026 totals. The separate 1200 × 630 featured cover is an original illustrated basketball graphic, not an authenticated photograph of the three athletes. A player appears only once in the ranked category.
Support BitcoinVersus.Tech
To make an optional 5,000-satoshi donation, scan the original BitcoinVersus.Tech QR below using a compatible Bitcoin wallet. On a phone, display the article on another screen or use the wallet’s supported saved-image scanning feature. Check the payment address and amount before authorizing.

We volunteer daily to ensure the information on this platform is Verifiably True. If you would like to support the research, please scan QR code.
BitcoinVersus.Tech sports statistics are provided for informational purposes, not gambling or wagering advice.


Leave a Reply