
The United States has passed 200 gigawatt-hours of installed battery energy storage capacity, according to a November 17, 2026 report from the Solar Energy Industries Association (SEIA) and Benchmark Mineral Intelligence. Developers commissioned 48.3 GWh during the first nine months of 2026, a 20% increase over the same period a year earlier. The threshold reflects cumulative installations, not batteries capable of discharging 200 gigawatts at once.
Battery storage absorbs electricity when supply is available and returns it later through inverters. A gigawatt-hour measures energy, while a gigawatt measures the rate of delivery. For example, a 100 MW battery operating at full output for four hours supplies 400 MWh before accounting for losses. The distinction is explained in our MW-versus-MWh technical guide.
U.S. Department of Energy Office of Electricity video, April 19, 2023, explaining grid-scale storage reliability, resilience and safety. Official historical background, not footage of the SEIA November 2026 report. Credit: U.S. Department of Energy / YouTube.
Utility-scale projects dominate new additions
The new Energy Storage Market Outlook Q4 2026 counted 40.8 GWh of utility-scale systems and 7.5 GWh behind the meter across January–September. Grid-connected batteries supplied most new capacity, but businesses and households are becoming meaningful contributors through backup, demand management and virtual power plants.
Third-quarter additions totaled 14.3 GWh, about 1% below Q3 2025 despite the stronger nine-month growth. The quarter included 12.2 GWh of utility-scale storage, approximately 1.3 GWh of commercial and industrial systems, and 746 MWh of residential installations. Component totals are rounded and should not be treated as independently precise to the last megawatt-hour.
Texas led utility-scale installations through September with 12.3 GWh, followed by Arizona at 7.7 GWh and California at 6.8 GWh. SEIA also reported that 11 states had already exceeded their previous full-year storage installation records by the end of Q3. Those figures describe where capacity was commissioned, not how much energy every project actually discharged.
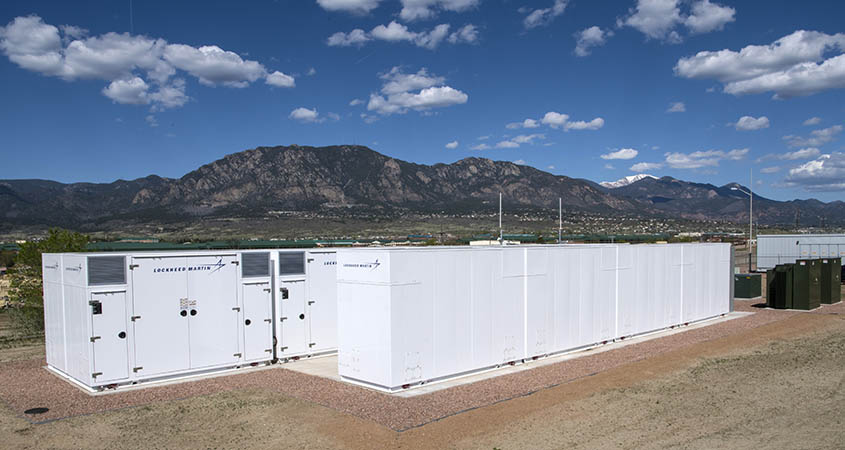
Grid flexibility and data centers
Batteries can reduce solar curtailment, shift generation toward evening peaks, stabilize frequency and respond rapidly to grid disturbances. A real deployment covered by BitcoinVersus.Tech’s FPL Lansing Smith report demonstrates why both the power rating and storage duration matter. Different operating modes create different revenue and reliability outcomes.
Large data-center loads are another growth driver. SEIA found 5.4 GWh of commercial, industrial and UPS-related battery installations through September, compared with 4.8 GWh during all of 2025. These systems can manage abrupt demand changes and provide short-duration backup, but they do not replace the power-quality role of properly designed UPS equipment. Large AI data-center cooling designs illustrate the rising infrastructure burden.
Manufacturing is growing alongside deployment. SEIA placed U.S. battery-cell manufacturing capacity at 92.4 GWh after plant openings in Tennessee and Indiana. Manufacturing capacity describes potential cell production over a specified period, not an existing stock of installed grid batteries. Supply-chain costs, plant utilization and domestic sourcing still require scrutiny.
Original 2018 national-laboratory video “Solar + Storage: Energy’s New Power Couple,” explaining battery support for peak grid demand. Archival educational context from the laboratory now called the National Laboratory of the Rockies, not an analysis of 2026 installations. Credit: NLR / YouTube.
The 2030 figure is a forecast
Lithium iron phosphate is expected to account for 92% of lithium-ion stationary-storage deployments in 2026, up from 77% in 2023, according to the industry forecast. Cost and material characteristics favor LFP in many stationary applications, but appropriate fire controls, thermal management, warranties, recycling plans and independent verification remain essential. Research into used-battery health testing addresses a different lifecycle challenge.
SEIA increased its projection for cumulative U.S. storage capacity in 2030 to 708 GWh, 3.7% above its prior forecast. The projection is contingent on financing, permitting, interconnection, equipment availability and market rules; it is not a contracted or operating total.
Other technologies may meet longer-duration needs, including pumped hydro and liquid-air storage. China’s 60 MW / 600 MWh liquid-air project offers a different comparison with grid batteries. Storage also consumes electricity when charging and cannot create net energy, making round-trip efficiency and dispatch timing critical.
The 200 GWh milestone establishes the scale of a rapidly expanding U.S. storage fleet. Its future value will depend less on installed energy alone than on usable discharge power, safety, duration, location, operating performance and whether operators can deliver power at times of greatest system need.
Sources and methodology: SEIA / Benchmark Mineral Intelligence November 17, 2026 release; Q4 2026 Energy Storage Market Outlook and executive summary; POWER magazine’s independent November 17 reporting; U.S. EIA August 2026 battery power-capacity analysis; U.S. Department of Energy explanation of grid storage. SEIA/BMI figures are reported energy capacity, while EIA figures in GW measure power and are not interchangeable.
Editor’s Note: The 200 GWh milestone is cumulative installed energy storage, not 200 GW of instantaneous generation. Figures for January–September 2026 describe commissioned storage. The 708 GWh figure for 2030 is an industry forecast, not completed construction. The original 1200 × 630 cinematic-anime cover depicts a fictional energy technician at a conceptual battery farm; it is not a photograph of a specific installation. The exact uploaded BitcoinVersus.tech secondary logo was reused at the bottom-left with neon-green lettering on a tight black highlight. The in-story image is authentic national-laboratory archival photography, and both official videos predate the new market report. Browser playback and mobile layout require independent validation.

BitcoinVersus.Tech is volunteer-run and publishes independent technical journalism. An optional 5,000-satoshi donation supports ongoing research. Scan the original QR from a second screen using a compatible Bitcoin wallet; on the same phone, use a wallet that can import a saved QR image when supported. Independently verify recipient 3C9o19EH5HSiwEPyCTmEKzxhNCbo2X6TTb and the 5,000-satoshi amount before sending. Bitcoin transfers are generally irreversible.
We volunteer daily to ensure the information on BitcoinVersus.Tech is Verifiably True. Technical and financial coverage is educational and informational, not personalized engineering, securities, tax or investment advice.


Leave a Reply