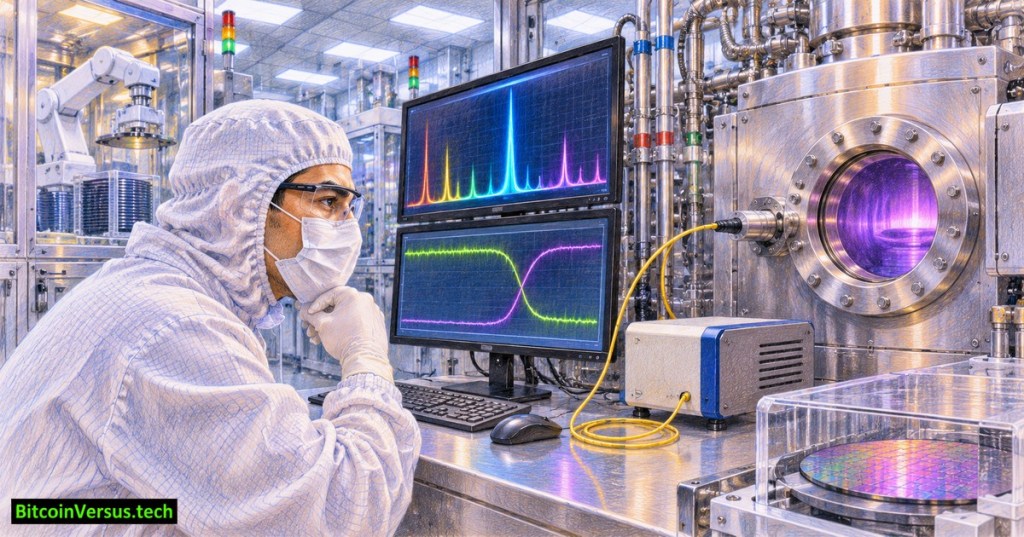
OSSTC.018 teaches how a semiconductor fabrication tool can recognize when a plasma etch has reached an intended material boundary. Optical emission spectroscopy (OES) collects light emitted by excited atoms, molecules and ions in a plasma. Changes in selected spectral signals can indicate an etch endpoint or a change in chamber conditions. A spectrometer observes plasma chemistry indirectly; it does not measure wafer thickness by looking through solid silicon.
The chapter follows OSSTC.017 on residual-gas analyzers. Both instruments support process diagnosis, but an RGA analyzes mass-to-charge signals in sampled gas while OES analyzes emitted light. HORIBA’s OES overview describes endpoint monitoring and chamber-to-chamber spectral comparisons.
How plasma light becomes a process signal
A chamber viewport and optical fiber guide plasma light to a spectrometer. The instrument separates wavelengths and reports relative intensity over time. Each emission feature depends on the emitting species and its excitation conditions. A falling by-product line might indicate depletion of the film being removed; a rising reactant line can indicate less consumption. Neither direction is universal. The Oxford Instruments endpoint reference describes both the mechanism and practical sensitivity limits.
Endpoint detection works best after process engineers validate a relevant wavelength, a baseline and a decision rule against known wafer results. A larger exposed etch area often produces stronger by-product signals; tiny patterned regions can yield weak or ambiguous changes. Review OSSTC.010 on plasma etch fundamentals for the role of ions, chemistry and selectivity.
An illustrative endpoint trace
Imagine a fictional classroom trace where a chosen emission line averages 5,000 detector counts before a transition and 3,200 counts afterward. Its relative change is (5,000 − 3,200) ÷ 5,000 × 100 = 36%. The arithmetic describes a measured change, not a qualified endpoint setting. A real detector could change for other reasons, including plasma power drift, gas-composition changes, window coating or a sensor problem.
One robust method evaluates signal trends over several samples and, where supported, compares multiple wavelengths or their ratios. False positives and false negatives must be checked against approved metrology. The EPFL microfabrication center distinguishes OES from laser reflectometry and interferometry, which track signals related more directly to optical changes at the wafer.
The machine behind the measurement
OES performance depends on stable process conditions. Chamber wall films, viewport deposits, altered gas flows and changes in RF coupling can affect the spectrum without a matching change in film thickness. Compare the wavelength trace with RF power, pressure, gas-flow and run-history records. OSSTC.015 covers pressure control; OSSTC.014 covers gas-flow tracking.
Read-only troubleshooting exercise
Inspect an authorized historical trend with an established process baseline. Record the recipe revision, chosen wavelength or ratio, signal sampling interval, endpoint timestamp and any associated alarms. Compare several successful runs with the suspect run, noting whether the change appeared at a plausible time. Check maintenance records and metrology before concluding that the film cleared. OSSTC.013 explains how chamber condition can affect process results.
Do not open plasma chambers, defeat interlocks, clean viewports, change gas recipes or override endpoint thresholds as part of a read-only exercise. Vacuum, RF energy, hazardous gases and stored energy require trained personnel and controlled procedures. Learning conclusion: OES provides valuable real-time evidence about plasma behavior, but a trustworthy endpoint requires a validated signal, stable operating conditions and confirmation from the broader process record.


Leave a Reply