Tech Docs
-
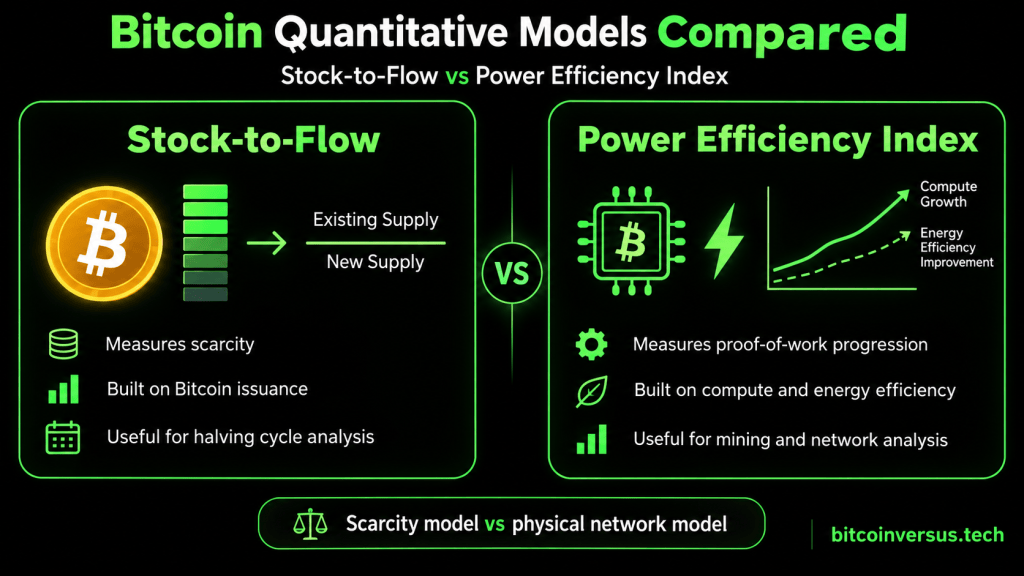
Bitcoin valuation models often begin with the same problem and arrive at very different answers. PlanB, known online as @100trillionUSD, introduced the Bitcoin Stock-to-Flow model in 2019 as a way to quantify scarcity and relate Bitcoin’s programmed supply schedule to market value. The Power Efficiency Index, developed by BitcoinVersus.tech, approaches valuation from the physical side…
-
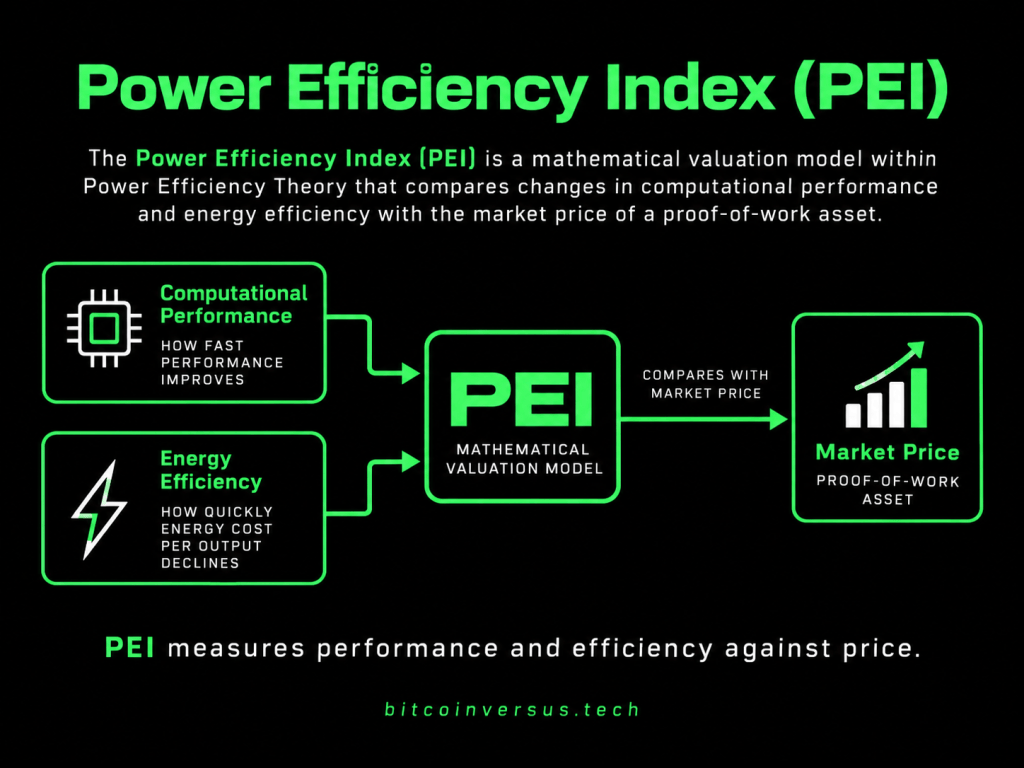
The Power Efficiency Index (PEI) is a mathematical valuation model within Power Efficiency Theory that compares changes in computational performance and energy efficiency with the market price of a proof-of-work asset. Developed by bitcoinversus.tech, PEI measures the growth in a network’s rate of compute alongside improvements in the energy required per unit of computation. In…
-

Physical price is the lowest observed market price of a proof-of-work digital asset during a defined measurement period, typically a calendar year, and is used in Power Efficiency Index (PEI) analysis as the market’s closest observable expression of a network’s underlying digital-physical value at that time. Rather than representing the total replacement cost of mining…
-
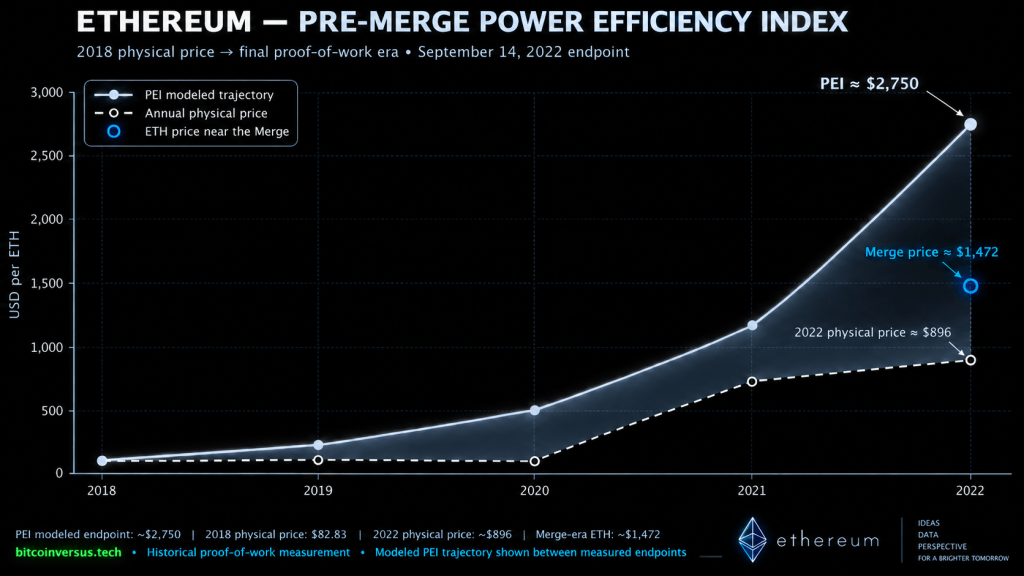
Ethereum’s final four years as a proof-of-work network provide a clean historical window for a Power Efficiency Index analysis. From 2018 through September 14, 2022, Ethereum still depended on mining hardware, network compute, and measurable energy efficiency. Its 2018 physical price was approximately $82.83, giving the PEI model a clear starting point. Over the following…
-

Dogecoin’s 2022–2026 Power Efficiency Index (PEI) shows a large gap between DOGE’s market price and the physical progression of the Scrypt mining infrastructure that helps secure the network. Using Dogecoin’s 2022 market low of roughly $0.0528 as the physical baseline, PEI measures how network computation and mining-machine energy efficiency have changed over time. Dogecoin is…
-
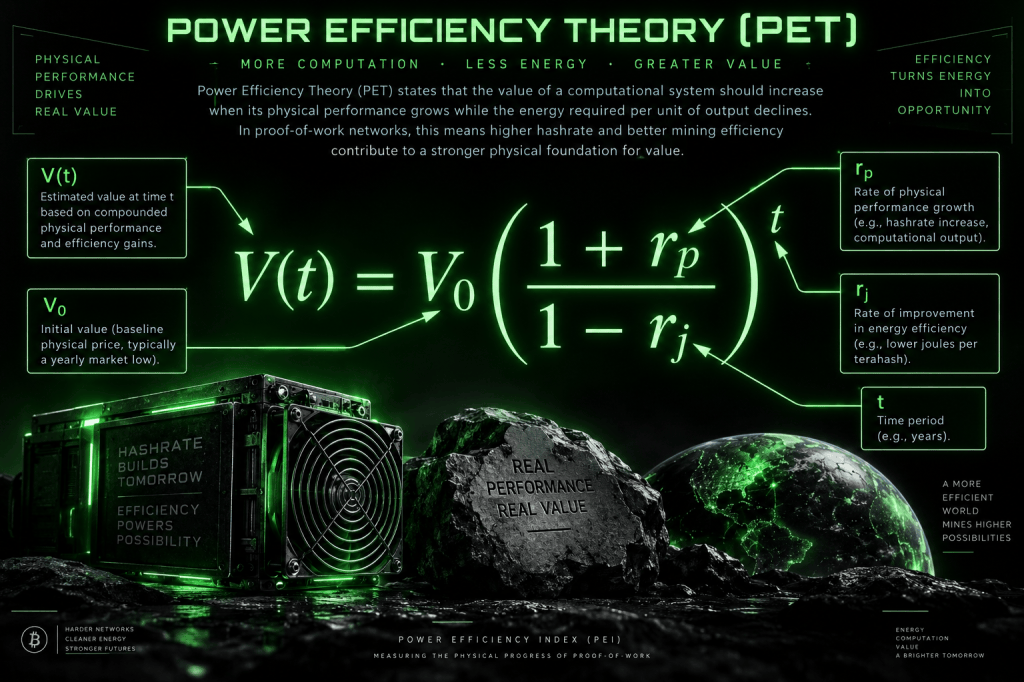
Power Efficiency Theory (PET) argues that the value of a physical or computational system should be influenced by two things improving at the same time: its performance increases and its energy cost per unit of output declines. In proof-of-work networks, this can be measured through factors such as network hashrate, mining-machine output, and ASIC efficiency.…
-
Zcash’s resurgence is interesting because it gives us a useful Proof-of-Work comparison outside of Bitcoin. Over roughly the past four years, the Zcash network increased from about 8.2 GSol/s to 25.4 GSol/s, while leading Bitmain Equihash hardware improved from roughly 3.60 J/KSol to 3.15 J/KSol. Under the Power Efficiency Theory framework, that produces an estimated…
-
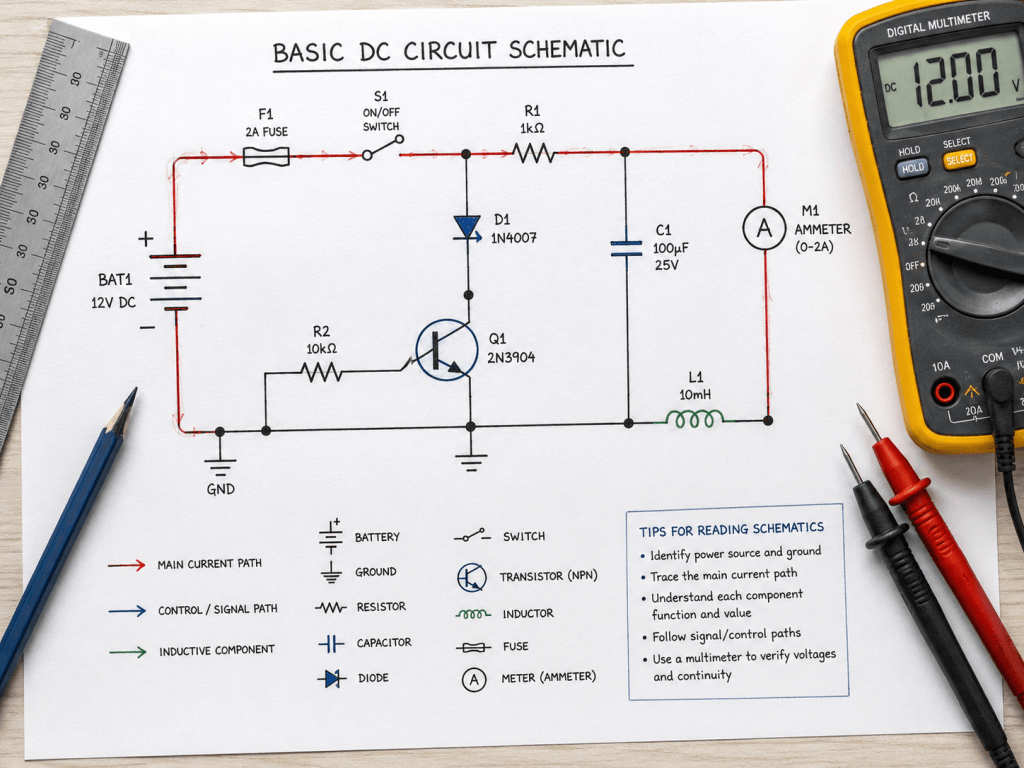
An electrical schematic is a symbolic representation of how components within an electrical or electronic system are connected. Rather than attempting to reproduce the physical appearance of a circuit board or machine, schematics use standardized symbols to describe components and electrical relationships. A technician can therefore examine a schematic and understand the intended current paths,…
-

Modern Bitcoin mining is increasingly defined by the performance of the chips themselves. Bitmain, Canaan, MicroBT, and Bitdeer compete to produce faster and more efficient SHA-256 ASICs, while emerging platforms such as Bitaxe and Proto are pushing the industry toward more accessible and open hardware development.
-

In a data center, some of the most important infrastructure practices are also some of the easiest to overlook. Cable bend radius is a perfect example. It simply describes how tightly a cable can be bent without risking physical damage or degrading its intended performance. Think of a cable going around a corner. Instead of…
-

Remote Direct Memory Access programming is a specialized method of moving data between computers with significantly less operating-system and processor involvement than conventional socket-based networking. An RDMA-capable network adapter can transfer data directly between registered memory regions, reducing repeated copying between application buffers, kernel buffers, and network-driver buffers. On Linux, applications commonly access this capability…
-

Control charts are a statistical process control tool used to monitor how a manufacturing, laboratory, maintenance, or business process changes over time. Measurements are plotted chronologically against a centerline and calculated upper and lower control limits, allowing technicians and quality teams to distinguish routine process variation from unusual conditions that may require investigation. A process…

