
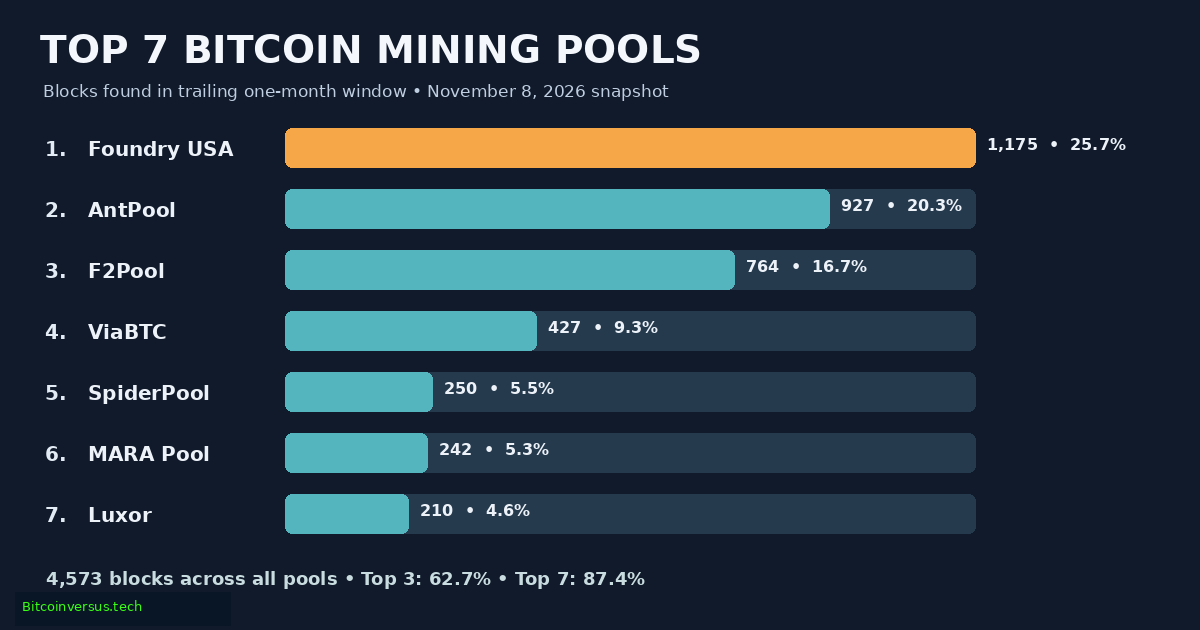
Bitcoin mining pools aggregate computing power from independent operators so block rewards can be distributed more predictably than in solo mining. Their relative size can be measured by the number of Bitcoin blocks attributed to each pool, rather than marketing claims about installed hashrate. In a trailing one-month dataset checked November 8, 2026, mempool.space recorded 4,573 blocks, with the seven most prolific pools responsible for 3,995, or 87.4%. Three pools alone found 62.7%.
Braiins, “Bitcoin Mining Stratum V2 – Braiins and Matt Corallo” (January 31, 2020). Official technical background on how pooled miners communicate and negotiate work; historical instruction, not a video of the November 2026 leaderboard.
Ranking the Seven Largest Pools by Blocks Found
The ranking uses one consistent mempool.space mining-pool API snapshot. Shares are calculated as each pool’s blocks divided by all 4,573 blocks. Percentages are rounded to one decimal, while the block counts remain exact within the source’s attribution system. The trailing one-month endpoint updates as new blocks arrive, so later views may differ.
1. Foundry USA — 1,175 blocks (25.7%). Foundry remained the largest identified pool, producing more than one in four blocks. The result provides a new measurement alongside BitcoinVersus.Tech’s earlier report on Foundry’s leadership transition and pool share.
2. AntPool — 927 blocks (20.3%). The second-place pool trailed Foundry by 248 blocks and accounted for roughly one-fifth of the network’s observed monthly block production.
3. F2Pool — 764 blocks (16.7%). The three largest pools together mined 2,866 blocks, equivalent to 62.7% of the sample. The finding extends the site’s earlier 24-hour top-three pool comparison with a substantially longer measurement window.
4. ViaBTC — 427 blocks (9.3%). ViaBTC was the only remaining identified pool above 400 blocks in the observed month.
The Peter McCormack Show, “The Decentralisation of Bitcoin Mining with Braiins” (April 5, 2023). Interview with Braiins founders Jan Čapek and Pavel Moravec about pool concentration, Stratum V2 and miner transaction selection. Historical context, not a current market-share measurement.
5. SpiderPool — 250 blocks (5.5%). Its share was substantially smaller than ViaBTC’s, illustrating the concentration of blocks among the leading four pools.
6. MARA Pool — 242 blocks (5.3%). MARA’s attributed production was only eight blocks behind SpiderPool, close enough for rankings to move over shorter observation periods.
7. Luxor — 210 blocks (4.6%). Luxor completed the leading seven, ahead of SECPOOL’s 188 and OCEAN’s 169 blocks in the same dataset.
What the Concentration Numbers Mean
Pools coordinate block construction and reward distribution, but many connected ASICs are owned by separate miners who can redirect their machines. Consequently, 62.7% of observed blocks attributed to three pools does not establish that three companies own 62.7% of mining hardware, coordinate maliciously or possess a proven ability to conduct a 51% attack. For protocol background, see centralized versus decentralized mining pools and Stratum V1 versus V2.
Block discovery is probabilistic. The number of blocks found can fluctuate around a pool’s underlying share of total network hashrate, and identification relies on coinbase signatures that can be missing, renamed or interpreted differently by competing trackers. The dataset also excludes independent verification of pools’ customer counts, energy costs and profitability. The ranking is therefore a block-production leaderboard, not a definitive ranking of company ownership or earnings.
Sources: mempool.space one-month blocks API; mempool.space API documentation; Braiins Pool technical background. Original calculations: top three = 2,866 ÷ 4,573 = 62.7%; top seven = 3,995 ÷ 4,573 = 87.4%.
BitcoinVersus.Tech Editor’s Note
Data captured November 8, 2026, from mempool.space’s trailing one-month mining-pool endpoint. The underlying reporting window is rolling, not a fixed October calendar month. Figures are block attributions, not directly measured ownership of physical ASIC hashrate. Percentages are independently recalculated from the published block counts. Both embedded videos predate the ranking and offer mining-protocol background only. The featured cover is conceptual imagery; the in-story chart is an original numerical visualization and does not repeat the cover.
We volunteer daily to ensure the information on this platform is Verifiably True. If you would like to support the research, please scan QR code.

Support independent reporting with an optional 5,000-satoshi donation. Scan the original QR with a Bitcoin wallet from a second screen, or use a compatible saved-image scanner on mobile. Check destination 3C9o19EH5HSiwEPyCTmEKzxhNCbo2X6TTb and amount before confirming payment.
BitcoinVersus.Tech is not a financial advisor. Financial coverage is provided purely for informational purposes.


Leave a Reply