
BitcoinVersus.Tech’s latest Power Efficiency Theory post places the Bitcoin Mining Singularity near 2046 if Bitcoin ASIC efficiency continues improving from today’s single-digit joules-per-terahash frontier. The date is plausible as a scenario, but it should not be presented as a forecast.
The current reference point is the Bitmain S23 XP Hyd., rated at 600 TH/s, 5,340 W and 8.9 J/TH. That is still a manufacturer-rated frontier rather than a broad field measurement from deployed fleets. BitcoinVersus.Tech’s earlier 8.3% scenario update annualized the recent move from 9.5 to 8.9 J/TH. For this report, AGR means the annual efficiency-improvement rate: the percentage by which J/TH falls each year.
The first correction is mathematical
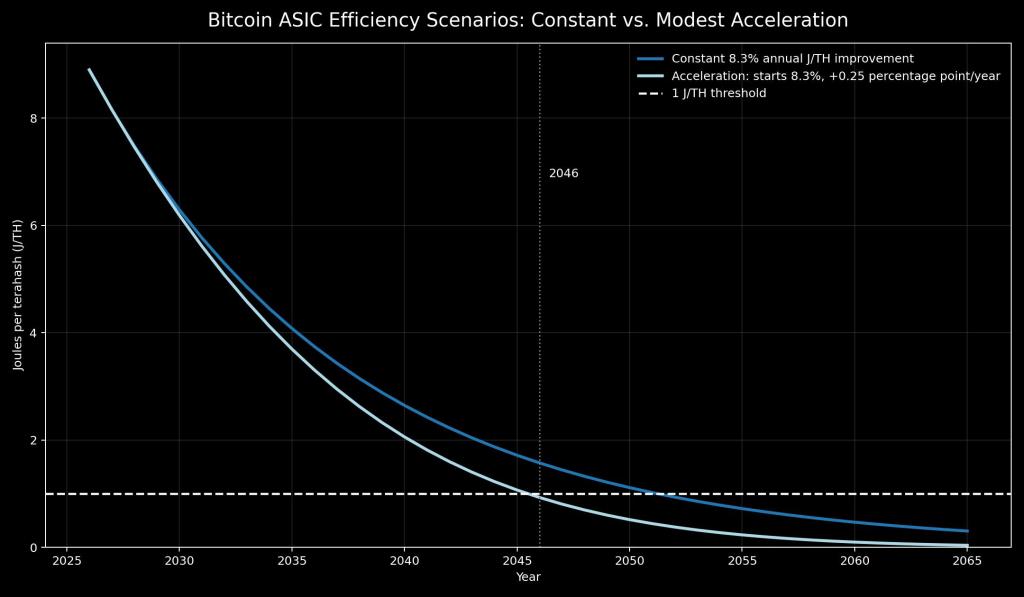
A flat 8.3% annual reduction does not reach 1 J/TH in 2046. Starting at 8.9 J/TH in 2026, the constant model is:
J(y) = 8.9 × 0.917(y−2026)
That produces about 1.57 J/TH in 2046 and first falls below 1 J/TH around 2052. The light-blue 2046 path therefore has to represent an accelerating improvement rate, not a constant 8.3% line.
What has to happen for 2046 to work
An illustrative acceleration model can make 2046 mathematically consistent. Start with an 8.3% improvement in 2026 and increase that annual improvement rate by only 0.25 percentage point per year. Under that rule, the annual rate reaches roughly 13% by the mid-2040s and the model crosses 1 J/TH in 2046.
This is where Ray Kurzweil’s Law of Accelerating Returns is useful as a hypothesis. Kurzweil argues that more capable technologies help create the next generation of technologies, creating positive feedback. That idea can justify testing an accelerating curve. It does not prove that SHA-256 ASIC efficiency will accelerate, and it should not be treated as a physical law governing mining hardware.
The countermodel is Diminishing Efficiency Returns
Power Efficiency Theory also needs the opposite case. As ASICs become more efficient, each additional reduction in J/TH may become harder to obtain because of transistor scaling, leakage, interconnect losses, voltage limits, power delivery, thermal density, packaging, cooling and economics. BitcoinVersus.Tech calls that pressure Diminishing Efficiency Returns. When technical limits and economic cost increasingly resist further gains, the model enters Thermoeconomic Capitulation.
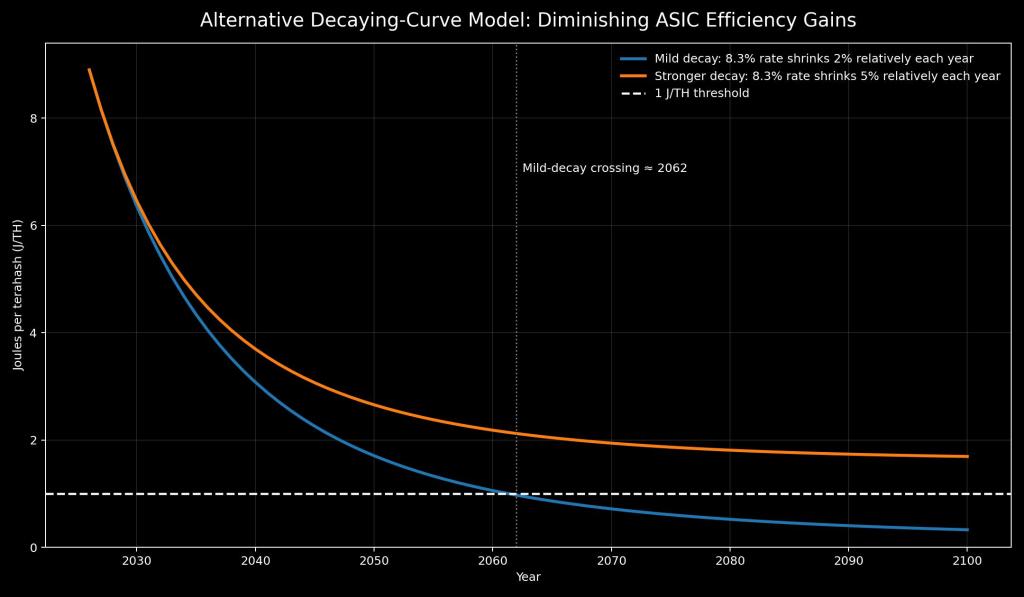
The alternative chart therefore lets the 8.3% AGR decay instead of accelerate. In the mild case, the annual improvement rate shrinks by 2% relative to the prior year. That delays the 1 J/TH crossing to about 2062. In the stronger case, the annual improvement rate shrinks by 5% relatively each year. That curve never reaches 1 J/TH; mathematically it approaches an efficiency floor near 1.63 J/TH.
Four scenarios from the same 8.9 J/TH starting point
| Scenario | Rate rule | Modeled J/TH in 2046 | 1 J/TH result |
|---|---|---|---|
| Constant AGR | 8.3% every year | 1.57 | ~2052 |
| Modest acceleration | Starts 8.3%; +0.25 percentage point/year | 0.93 | ~2046 |
| Mild decay | 8.3% rate shrinks 2% relatively/year | 2.13 | ~2062 |
| Stronger decay | 8.3% rate shrinks 5% relatively/year | 2.97 | No crossing; approaches ~1.63 |
Why the acceleration case is not unreasonable — and not enough
Computing history gives some support for testing continued nonlinear efficiency improvement. A 2025 peer-reviewed reassessment of Koomey’s Law found that high-performance-computing energy efficiency continued to improve exponentially from 2008 through 2023, but more slowly than the earlier historical trend: maximum efficiency doubled roughly every 2.29 years instead of every 1.57 years. That is evidence for both sides of this report. Efficiency can keep compounding for long periods, while the rate itself can slow.
Bitcoin ASICs are not supercomputers, and SHA-256 is a specialized workload. The comparison cannot establish a Bitcoin-mining date. It simply shows why both acceleration and deceleration deserve to be modeled rather than selecting one curve because it produces the preferred year.
Where this sits inside Power Efficiency Theory
The original Bitcoin Mining Singularity defines 1 J/TH as a research milestone for mining-machine energy efficiency. It is not a claim that 1 J/TH is the absolute thermodynamic limit of computation.
Power Efficiency Theory separates the Rate of Compute from the Rate of Energy Efficiency. Compute can rise through machine hashrate or network hashrate, while energy efficiency improves as J/TH falls. Their compounded progression can then be measured with the Power Efficiency Index.
Within PEI, Physical Price is the observed market-price baseline selected for a measurement window. Relative Price is the model-implied price after applying compounded compute and efficiency progression. Valuation Divergence is the gap between that Relative Price and Actual Price. Those valuation terms do not determine when 1 J/TH arrives. They belong to the valuation layer of Power Efficiency Theory, while the Singularity curves belong to the engineering layer.
The skeptical conclusion
2046 is a defensible scenario, not a defensible certainty. A fixed 8.3% AGR does not get there; it points closer to 2052. A modestly accelerating AGR can get there. A decaying AGR can push the milestone into the 2060s or prevent the model from reaching 1 J/TH at all.
The most useful prediction is therefore not the year itself. It is the test: every new leading ASIC generation can be plotted against the acceleration curve and the Capitulation Curve. If realized efficiency gains begin widening again, the 2046 case strengthens. If gains continue shrinking, Thermoeconomic Capitulation becomes the better description.
The Bitcoin Mining Singularity should move when the data moves.
BitcoinVersus.Tech Editor’s Note:
We volunteer daily to ensure the credibility of the information on this platform is Verifiably True. If you would like to support to help further secure the integrity of our research initiatives, please donate using the QR code provided

For best QR-code scanning results, please scan this donation code from a desktop or larger screen. Mobile screens may prevent camera recognition.
BitcoinVersus.tech is not a financial advisor. This media platform reports on financial subjects purely for informational purposes.
Research disclaimer: These curves are scenario models built from stated assumptions. Manufacturer-rated ASIC specifications are not the same as broad independent field measurements. Power Efficiency Theory and PEI are experimental research frameworks, not guaranteed hardware forecasts, fair-value determinations or investment advice.


Leave a Reply