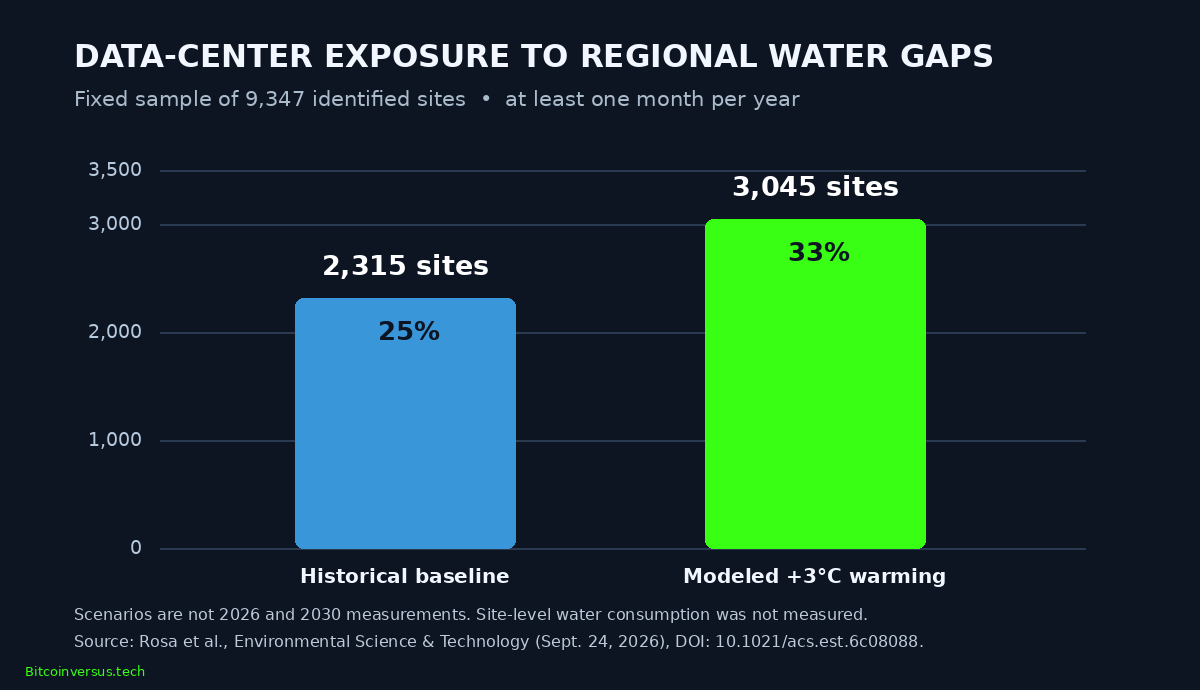
A peer-reviewed analysis of 9,347 identified data centers worldwide found 2,315 sites, or 25%, in regions modeled to experience at least one month of water shortfall annually under historical conditions. The September 24, 2026 study adds a geographic measurement to concerns highlighted by CNBC’s November 5 investigation of AI data-center cooling. Its crucial qualification: the research maps regional water stress, not actual water consumed by each facility.
CNBC, “The Truth About How Data Centers Use Water And Power To Keep Cool,” November 5, 2026. The report visits cooling infrastructure and explains the electricity–water trade-off. Credit: CNBC / YouTube.
One quarter of sites overlap water gaps
Researchers led by Lorenzo Rosa mapped known data-center locations against monthly water availability and competing demand. Their historical benchmark uses 2001–2010 hydrological conditions, not direct readings from 2026 cooling plants. The authors found that 961 sites overlapped regions with 1–4 months of water gaps, 831 with 5–8 months and 523 with 9–12 months.
Under a modeled +3°C global-warming scenario, exposure rises to 3,045 sites, or 33%—730 additional locations in the same fixed sample. The warming scenario is not a prediction for 2030. The underlying 50-kilometer-scale regional model cannot determine whether a particular facility uses fresh water, reclaimed water or dry cooling, and the authors did not measure individual facility demand.
Closed-loop cooling does not make heat disappear
Modern direct-to-chip liquid loops circulate coolant near GPUs, carry heat to a coolant distribution unit and return cooled fluid for reuse. Reusing coolant inside the building does not determine how heat ultimately leaves the property. An outside dry cooler can reject heat with fans and little onsite water. An evaporative cooling tower sacrifices water to remove heat, often reducing electricity needed for comparable cooling conditions. Hybrid systems adjust their behavior with weather and operating load.
Water usage effectiveness, or WUE, measures liters of water consumed per kilowatt-hour of IT electricity. Power usage effectiveness, or PUE, divides total facility electricity by IT electricity. Lower onsite WUE can coincide with higher PUE, and electricity generation can involve additional offsite water consumption. The cooling-loop, cooling-tower and blowdown distinctions are covered in BitcoinVersus.Tech’s data-center water-systems lesson and cooling technology comparison.
Microsoft Datacenters in Your Community, “Understanding water use at Microsoft datacenters,” October 2, 2025. Official explanation of ambient, evaporative and liquid-to-chip methods; company descriptions are not independent site audits. Credit: Microsoft / YouTube.
A one-gigawatt facility has no universal water bill
Consider an illustrative facility with 1 GW of sustained IT load and WUE of 1 liter per IT kilowatt-hour. Multiplying 1,000,000 kW by 24 hours and 1 L/kWh gives 24 million liters daily, equivalent to roughly 6.34 million U.S. gallons. The calculation is conditional, not a measured 1 GW facility’s consumption. Actual use varies with climate, utilization, cooling topology, sourcing and whether water is withdrawn or consumed.
An October 27 thermodynamic study modeled evaporative cooling water intensities of 0.69–1.01 L/kWh across selected warm-climate locations, highlighting why a single global gallon figure is unreliable. Previous liquid-cooling efficiency research examines power savings but should not be read as a guarantee of equal water savings.
Equinix, “How Data Centers Optimize Energy and Water for Cooling Solutions,” February 26, 2025. Official overview of facility-level air, liquid and heat-reuse systems; promotional examples are not independently reproduced field measurements. Credit: Equinix / YouTube.
Communities need local measurements
Permit reviews should distinguish daily average from peak summer water demand, withdrawals from consumptive losses, IT load from total facility electricity, and promised future cooling methods from commissioned systems. Operators can evaluate reclaimed water, dry cooling, thermal storage and heat reuse, but each option carries costs or infrastructure requirements. Relevant earlier coverage includes Google’s air-cooling plan, OpenAI’s community reporting pledge and projected electricity demand.
The researchers warn that overlapping a water-stressed region does not prove a data center caused its water shortage. Local metering, cooling design, seasonal water budgets and grid generation sources remain necessary before attributing impacts or selecting a cooling system.
Primary research: Rosa and coauthors, Environmental Science & Technology, September 24, 2026; Sánchez and coauthors, Energy Nexus, October 27, 2026; Cooper and Nguyen, Fluids, August 14, 2026. Numerical conversions use U.S. gallons and a hypothetical sustained IT load, not an actual operator’s readings.
BitcoinVersus.Tech Editor’s Note
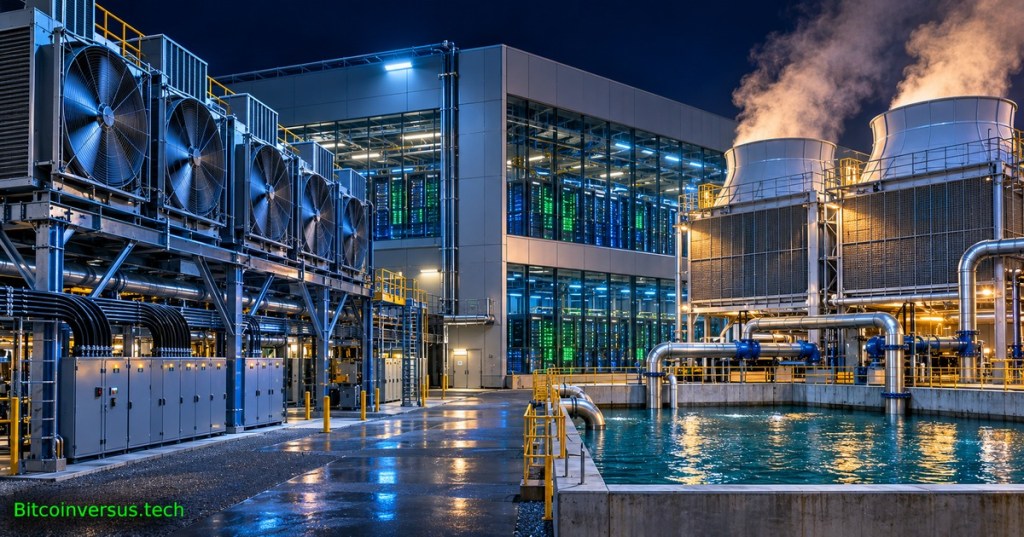
Published November 8, 2026. The 25% and 33% shares refer to modeled overlap of data-center locations with regional water-gap conditions, not recorded water consumption, facility shutdowns or a 2026-to-2030 trend. The +3°C analysis uses the same identified 9,347 sites and an assumed warming level, not a specific forecast year. The 1 GW illustration is conditional arithmetic, not an estimate of CNBC’s featured locations. The original cover is conceptual artwork, not an actual photographed facility. The CNBC report is journalism; the Microsoft and Equinix videos are corporate explanations.
We volunteer daily to ensure the information on this platform is Verifiably True. If you would like to support the research, please scan QR code.

To contribute an optional 5,000 satoshis, scan the QR with a Bitcoin wallet from a second screen. On mobile, save the QR and choose a compatible wallet’s image-scanning feature. Verify the destination 3C9o19EH5HSiwEPyCTmEKzxhNCbo2X6TTb and amount before sending.


Leave a Reply