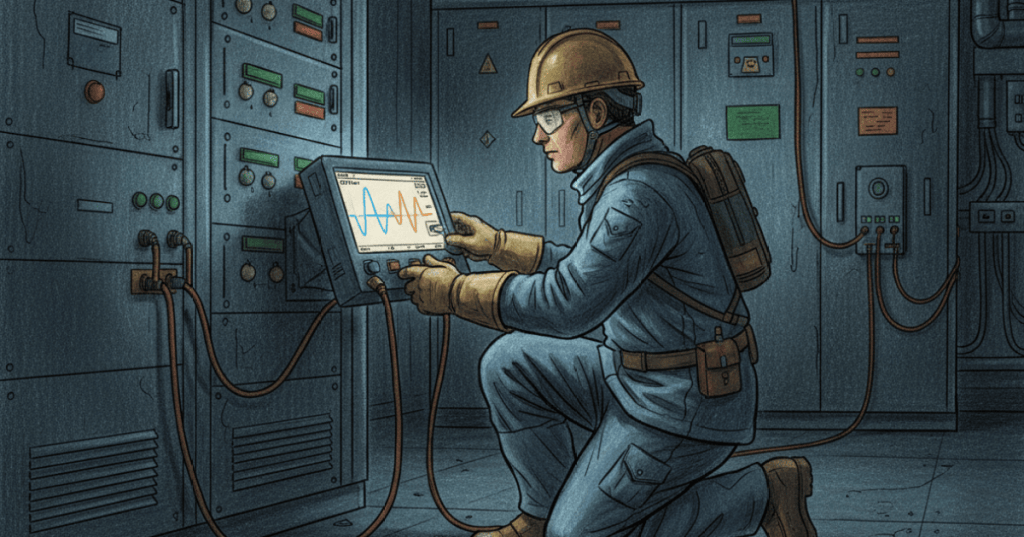
Power Quality Is the Shape and Stability of the Power You Deliver
Power quality describes how closely the voltage, current, frequency, phase balance, and waveform at a load match what the electrical system is designed to deliver. A facility can have the correct nominal voltage and still have poor power quality because the waveform is distorted, the voltage drops briefly, the phases are unbalanced, or fast transients are riding on top of the sine wave. This lesson follows OSEEC.014: Arc-Flash Engineering and builds on three-phase power, transformers, and power factor. Schneider Electric’s power-quality overview highlights harmonics, flicker, chronic over/undervoltage, and voltage sags as distinct problems that can affect reliability and equipment performance.
Harmonics and Total Harmonic Distortion
A perfect AC supply is sinusoidal at the fundamental frequency, typically 60 Hz in much of North America. Harmonics are voltage or current components at integer multiples of that fundamental: the 3rd harmonic of 60 Hz is 180 Hz, the 5th is 300 Hz, and so on. Nonlinear loads such as switch-mode power supplies, UPS systems, variable-frequency drives, inverters, LED drivers, and large fleets of IT equipment can draw current in pulses rather than as a clean sine wave. The resulting harmonic currents can distort system voltage, raise heating in transformers and conductors, increase neutral current, create resonance problems, and cause controls to misbehave. Total harmonic distortion (THD) condenses the non-fundamental content into one ratio: THD = √(V₂² + V₃² + V₄² + …) / V₁ × 100% for voltage, with the same basic form for current.
Voltage Sags, Swells, Interruptions, and Transients
Voltage sags are short reductions in RMS voltage; swells are short increases. IEEE power-quality guidance commonly treats a sag as roughly 0.1–0.9 per-unit RMS and a swell as roughly 1.1–1.8 per-unit over durations from about half a cycle to one minute. Motor starting, feeder faults, breaker operations, sudden load changes, and utility events can all create these disturbances. A brief sag may be enough to trip a semiconductor tool, PLC, relay, VFD, or server power supply even though a handheld meter never shows anything unusual. Transients are much faster spikes, often associated with lightning, switching, capacitor operations, or inductive load changes. This is why critical facilities such as data centers and fabs need event capture and waveform recording rather than only spot voltage readings.
Measure Power Quality With the Right Instrument and the Right Location
A standard digital multimeter is excellent for many voltage and current measurements, but it usually cannot characterize fast disturbances, harmonic spectra, event duration, or the relationship between three phases over time. A power-quality analyzer can log RMS voltage and current, frequency, phase unbalance, power factor, harmonics, THD, dips, swells, interruptions, and transient events. Measurement location matters just as much as the instrument. Engineers often begin at the service entrance or point of common coupling, then move downstream toward switchgear, panelboards, PDUs, motor-control centers, or suspect loads. Correlating voltage and current trends helps separate an upstream source problem from a downstream load problem.
THD Is Useful, but Engineers Still Need the Harmonic Spectrum
THD is useful because it compresses many harmonic components into one number, but it can hide which frequencies are actually causing the problem. A 5th-harmonic-heavy system behaves differently from one dominated by triplen harmonics such as the 3rd, 9th, and 15th. The harmonic spectrum shows the magnitude of each harmonic order and helps connect measured distortion to likely sources. Engineers also distinguish voltage distortion from current distortion and may use total demand distortion (TDD) when evaluating harmonic current against a facility’s demand current. IEEE 519 is commonly used at the point of common coupling when evaluating harmonic limits, while IEC 61000-4-30 defines standardized methods for measuring power-quality parameters.
Engineering Workflow
- Define the symptom. Record trips, resets, overheating, flicker, nuisance alarms, failed power supplies, or unexplained process interruptions.
- Review the one-line diagram. Identify sources, transformers, switchgear, feeders, protective devices, major nonlinear loads, and sensitive equipment.
- Choose the measurement point. Start where the problem is visible, then compare upstream and downstream points.
- Capture synchronized voltage and current. Log long enough to include the operating condition that triggers the issue.
- Review RMS trends and event logs. Identify dips, swells, interruptions, frequency changes, and phase unbalance.
- Inspect waveforms and harmonic spectra. Compare THD, individual harmonic orders, and current loading.
- Correlate time stamps. Match electrical events against motor starts, UPS transfers, process changes, breaker operations, or utility events.
- Mitigate the root cause. Possible solutions include load redistribution, stronger source impedance, transformer changes, line reactors, passive or active harmonic filters, surge protection, UPS ride-through, voltage regulation, wiring repairs, or control-setting changes.
- Measure again. Confirm that the mitigation actually improved the system rather than moving the problem elsewhere.
Worked THD Example
Suppose the 60 Hz fundamental voltage component is 277 V, the 3rd harmonic is 5 V, the 5th is 8 V, and the 7th is 4 V. The harmonic RMS content is √(5² + 8² + 4²) = √105 ≈ 10.25 V. Voltage THD is therefore 10.25 / 277 × 100 ≈ 3.70%. That single result says the waveform contains measurable distortion, but the spectrum still matters because it tells the engineer that the 5th harmonic is the largest of the three measured components.
Exercises
- A 60 Hz system has a 5th harmonic. Calculate its frequency.
- A 480 V load experiences a 0.75 per-unit sag. Calculate the sagged RMS voltage.
- Explain why a brief voltage sag may reboot a control system even when a handheld meter reads normal voltage before and after the event.
- List four nonlinear loads that can create harmonic current.
- Explain why measuring only THD is not enough for a complete harmonic investigation.
- Describe how simultaneous voltage and current recording can help distinguish an upstream sag from a load-induced downstream sag.
- On a one-line diagram, mark three logical measurement points for investigating repeated UPS input alarms.
Knowledge Check + Answers
- What is a harmonic? A voltage or current component at an integer multiple of the system’s fundamental frequency.
- What does THD measure? The combined RMS magnitude of harmonic content relative to a reference, commonly the fundamental component.
- What is the 3rd harmonic on a 60 Hz system? 180 Hz.
- What is a voltage sag? A short-duration reduction in RMS voltage below its nominal range.
- What is a voltage swell? A short-duration increase in RMS voltage above its nominal range.
- Why are transients different from sags and swells? Transients are much faster high-frequency or impulsive events, often lasting microseconds to milliseconds rather than many cycles.
- Why use a power-quality analyzer instead of only a DMM? It can capture three-phase waveforms, harmonics, THD, event duration, trends, and transient behavior over time.
- What is the point of common coupling? The electrical point where a customer or load connects to the wider distribution system and where harmonic performance is often evaluated.
Primary Technical References
- Fluke — Causes and Effects of Harmonics in Electrical Power Systems
- IEEE Technology Navigator — Power Quality
BitcoinVersus.Tech
Editor’s Note:
We volunteer daily to ensure the credibility of the information on this platform is Verifiably True. If you would like to support our research initiatives, please donate here: 3C9o19EH5HSiwEPyCTmEKzxhNCbo2X6TTb
BitcoinVersus.tech is not a financial advisor. This media platform reports on technical and financial subjects purely for informational purposes.


Leave a comment