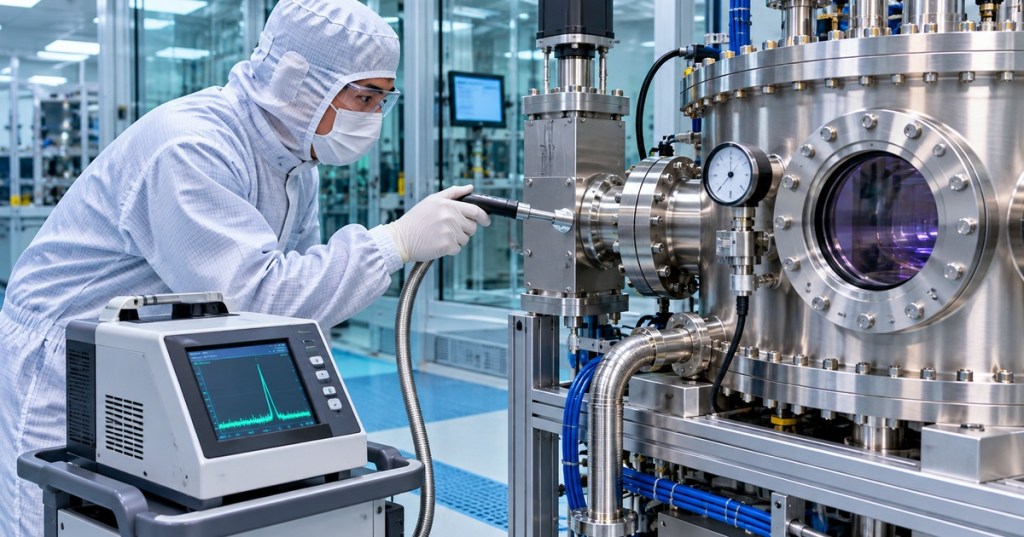
OSSTC.016 introduces systematic leak diagnosis in semiconductor vacuum systems. A process chamber that cannot reach its required base pressure may have a physical leak, but moisture desorption, trapped gas, a contaminated gauge, an incorrectly positioned valve, or reduced pumping performance can produce similar symptoms. A technician should not label every pressure rise as a leak or begin applying tracer gas before confirming the equipment’s safe maintenance state.
The chapter follows OSSTC.015, Chamber Pressure Control, which examined pressure sensors, throttle valves and pumpdown diagnostics. Earlier OSSTC.003, Semiconductor Vacuum Systems introduced roughing and high-vacuum hardware. The present lesson concentrates on distinguishing gas sources using pressure-rise trends and the fundamentals of tracer-gas leak detection rather than repeating pump construction.
Learning Objectives and Prerequisites
- Define a real leak, outgassing, permeation, and a virtual leak in a vacuum installation.
- Explain the meaning of total gas load and calculate an apparent gas throughput from the rate of pressure rise.
- Keep millibar, liter, second, pascal, and cubic-meter units consistent in leak-rate calculations.
- Compare an isolated chamber pressure-rise test with helium tracer-spray, sniffing and integral leak tests.
- Recognize false diagnoses caused by gauge behavior, trapped volumes, unstable temperature, and contamination.
- Create a safe, evidence-based diagnostic record, and distinguish observations from inferred causes.
Prerequisites include basic pressure measurement, vacuum pump operation, cleanroom contamination control, and the relationship among chamber volume, gas load and pumping speed. This chapter is an intermediate conceptual treatment within the Open Source Semiconductor Technician track. It is not authorization to operate a helium detector, modify gas lines, open a vacuum chamber, or isolate a live process system. Only qualified personnel following site-specific procedures may perform equipment tests.
Why an Elevated Base Pressure Is Not a Diagnosis
The pressure inside a vacuum vessel is influenced by incoming gas and the effective speed with which pumps remove it. A large leak can introduce atmospheric gas through a flawed seal or flange, but a well-sealed chamber can also release molecules from its internal surfaces. Manufacturing environments add complications such as process residues, elastomer seals, foreline conditions, chamber heating, valve leakage, and earlier gas exposure.
The Leybold vacuum fundamentals reference defines leak rate as gas throughput and emphasizes that a chamber need not be absolutely leak-free; it must meet its own process-specific pressure and gas-tightness requirement. Comparing readings without knowing the target specification, gauge type, measured gas, and operating state is unreliable.
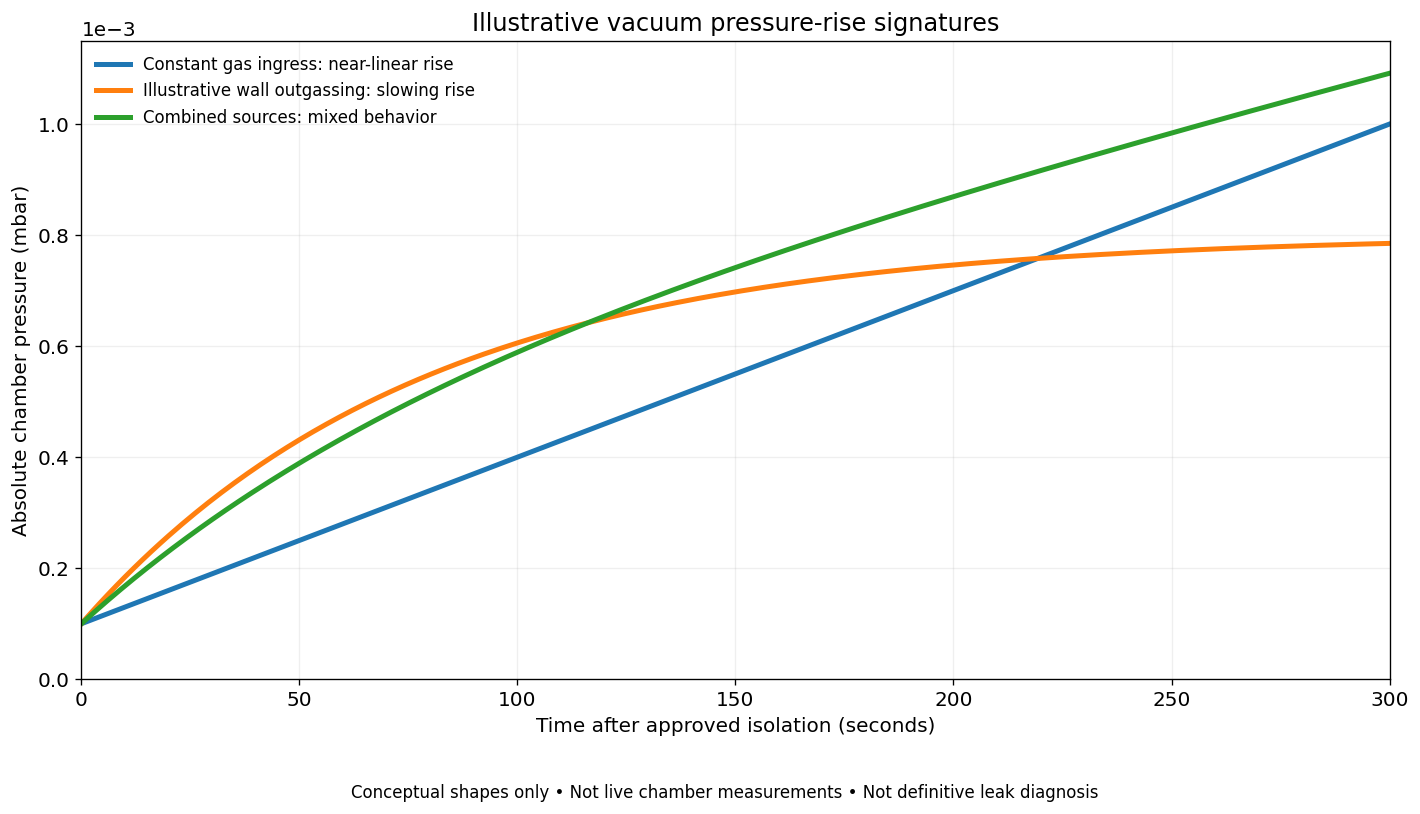
A small real leak tends to add gas at a roughly steady rate when the external-to-internal pressure difference remains approximately fixed. Outgassing instead releases adsorbed or absorbed gas from surfaces and materials. Virtual leaks may result when pockets of trapped gas communicate only slowly with the main evacuated volume, such as behind an improperly vented blind hole or inside an inaccessible cavity. Permeation through a material can contribute gas load without a visible opening.
Agilent Technologies, “Best Practices for Leak Testing Large Vacuum Chambers,” published April 6, 2022. A manufacturer webinar explaining detector selection, connection principles, and controlled helium-tracer testing of large vacuum vessels. Classroom context only; use approved equipment-specific procedures for real tests.
Pressure Rise After Isolation
A pressure-rise or rate-of-rise test records chamber pressure after the vacuum volume has been placed in an approved, safely isolated condition. With a fixed chamber volume, approximately constant gas temperature, and no active pumping into or out of the isolated volume, the observed gas throughput is estimated by Qobserved = V × (Δp / Δt). Here V is the effective connected volume in liters, Δp the change in absolute pressure in millibar, and Δt the elapsed time in seconds. The answer has units of mbar·L/s.
Important distinction: Qobserved includes all sources producing pressure rise. Only after excluding outgassing, virtual leaks and other contributions should it be interpreted as an actual leak rate Qleak. A pressure-rise test alone does not reveal where the leak is located. Leybold’s pressure-rise and pressure-drop reference expressly distinguishes real leakage from gas released by the vessel walls.
Worked Calculation with Explicit Units
Consider a hypothetical isolated vessel with an effective volume of 30 L. Its pressure reading rises from 2.0 × 10⁻⁴ mbar to 8.0 × 10⁻⁴ mbar over 600 seconds. The initial and final pressures are measurements assumed for an exercise, not values from an actual semiconductor machine.
Pressure difference: Δp = (8.0 − 2.0) × 10−4 mbar = 6.0 × 10⁻⁴ mbar.
Average pressure-rise rate: Δp/Δt = (6.0 × 10⁻⁴ mbar) / 600 s = 1.0 × 10⁻⁶ mbar/s.
Apparent total gas throughput: Qobserved = 30 L × 1.0 × 10−6 mbar/s = 3.0 × 10⁻⁵ mbar·L/s. Using 1 mbar·L/s = 0.1 Pa·m3/s, the result is 3.0 × 10⁻⁶ Pa·m3/s. The arithmetic was independently recalculated from the stated assumptions.
The figure is a gas-load observation, not proof of a 3.0 × 10⁻⁵ mbar·L/s hole. A nonzero rate may be caused partly or entirely by water vapor leaving internal surfaces or gas escaping trapped voids. Chamber volume estimates must also include connected manifolds and instrument spaces as appropriate; using only the nominal wafer-chamber size can misstate the result.
Reading Pressure Curves without Overclaiming
An approximately straight pressure-rise line over a suitable interval is consistent with a steady source, but it does not conclusively establish a real leak. A declining slope can be consistent with diminishing outgassing. A combination of leak influx and desorption can mimic a nearly linear trend over a short period. Temperature changes, nonuniform gas distribution, gauge warmup, sensor zero shift, and conductance restrictions may further distort interpretation.
The Agilent ultra-high vacuum education series explicitly discusses differentiating virtual and real leaks, including desorption, trapped volumes, diffusion, and backstreaming. In a troubleshooting record, describe the observed curve first, then label the possible cause as a hypothesis pending confirmation. Avoid assigning an exact gas species from a pressure trend alone.
Helium Tracer Testing and Why the Method Matters
Helium is widely used as a tracer for high-sensitivity vacuum leak detection because suitable mass-spectrometer detectors can distinguish a helium signal from ordinary chamber background. The detector responds to tracer gas transported to its analyzer through an approved connection or sampling arrangement. Detection sensitivity, measurement range and response time depend on the detector, plumbing conductance, test method, background helium and calibration conditions.
A tracer spray method typically evaluates a component already under vacuum: tracer gas presented locally outside a suspected seam may enter through an actual leak and become detectable on the evacuated side. A sniffing method evaluates a component that has been approved for a tracer-gas pressure test: escaping gas can be sampled externally by a probe. An integral test measures leakage for an entire part or assembly using a defined enclosure or chamber, but may not localize the physical defect. These distinctions are documented by Pfeiffer Vacuum’s leak-detection methods reference.
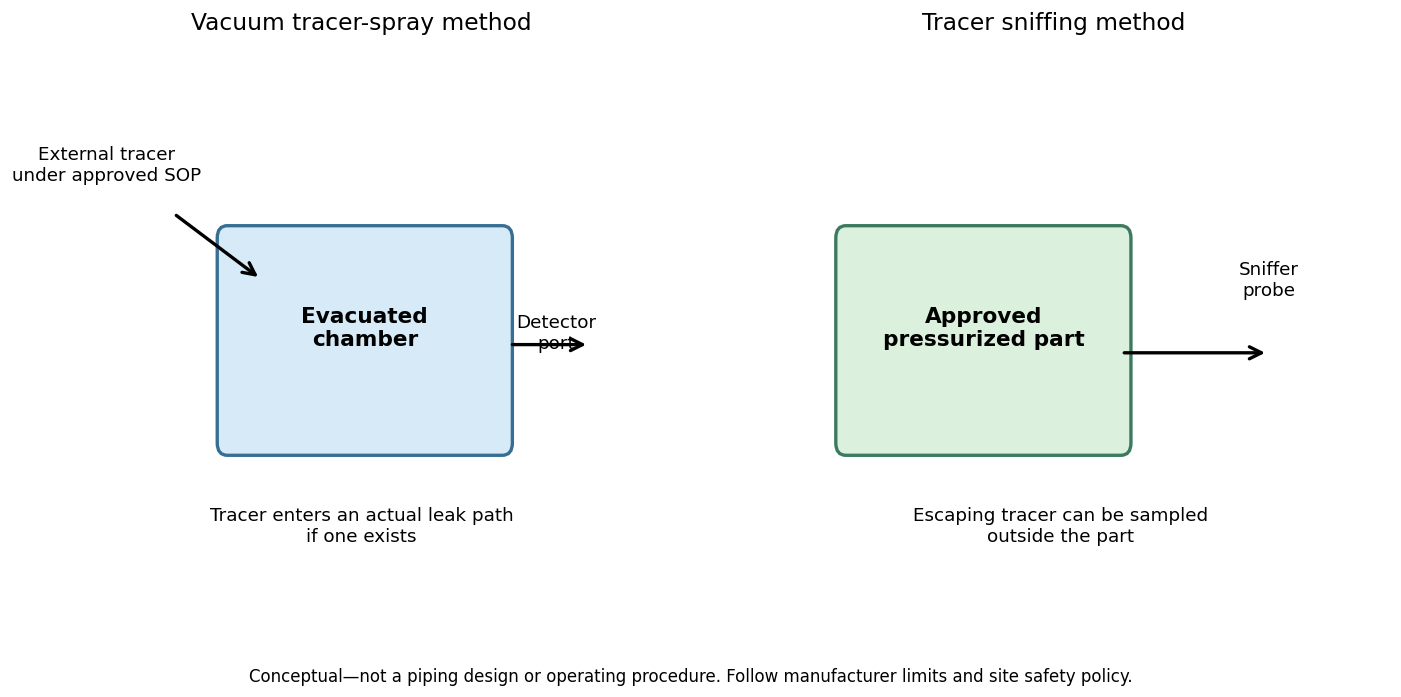
The required direction of the pressure differential determines which tracer method is meaningful. A spray test conducted on a chamber that is not properly prepared for the method may produce misleading results. A sniff test carried out on equipment that is not rated for pressure can be dangerous. Helium detector use also raises operational issues involving background contamination, gas-cylinder handling, oxygen displacement in enclosed spaces, cleanroom compatibility and manufacturer limits. Only trained personnel following approved engineering procedures should operate the equipment.
Pfeiffer Vacuum+Fab Solutions, “Leak detection methods — part 1: Integral test of parts under vacuum in helium,” published May 25, 2018. Manufacturer animation of an integral helium method. Its method is not identical to local external spray testing or pressurized-part sniffing.
A Safe Technician Evidence Workflow
- Identify the applicable recipe and limit. Record the required pressure range, chamber ID, process state, sensor type, firmware or controller revision, and applicable maintenance instruction. Do not infer one universal acceptable leak threshold for every semiconductor process.
- Review historic operating data. Compare the latest pumpdown trace with a baseline from the same tool configuration, including gauge, pump, throttle valve, MFC behavior, and foreline conditions.
- Check for confounding sources. Review whether recent venting, solvent exposure, cleaning, process-gas residue, maintenance, temperature transitions or chamber opening could increase outgassing or change gauge response.
- Plan any approved diagnostic test. Only qualified technicians should authorize isolation, gauge range verification, pump configuration, tracer methods and pressure limits through the equipment procedure. Never defeat interlocks for the lesson.
- Record the test in units. Preserve timestamps, absolute pressure units, effective volume, sensor status, elapsed time, and the presence of any active pumping or gas injection. A trend calculated without a correct system boundary may be meaningless.
- Escalate with evidence. If the outcome remains ambiguous, request a qualified vacuum specialist’s targeted leak test. A physical repair should follow confirmed localization, component instructions and production change control.
Common False Positives, False Negatives, and Failure Modes
- Virtual leak or trapped gas: a pocket empties slowly into the system, giving an apparent leak signal without a direct connection to atmosphere.
- Moisture or contamination: water or process deposits release vapor from surfaces after venting or cleaning; the apparent gas load changes with time and temperature.
- Wrong gauge regime: a Pirani sensor’s gas dependence or an instrument outside its valid operating range can compromise a comparison with another gauge.
- Valve or bypass leakage: an isolation valve that is assumed shut may connect the chamber to a different volume, affecting the pressure-rise boundary.
- Helium background: residual tracer gas can raise baseline signal and create false positives in subsequent checks.
- Slow detector response: long lines, restricted conductance or a large chamber can delay arrival of tracer gas, making an operator miss or misattribute a signal.
- Overpressurization: vacuum flanges, windows, bellows or chamber vessels may not be designed for positive internal pressure; a pressurized sniff test requires separate engineering authorization.
- Confusing total gas load with a leak: the equation Q = VΔp/Δt does not independently separate genuine leakage, outgassing and virtual leaks.
Cleanliness and process compatibility are especially important in semiconductor equipment. The earlier OSSTC.013 chamber-contamination lesson explains why an apparently harmless diagnostic intervention can introduce particles. The OSSTC.004 gas-delivery lesson explains why process gas distribution and purge interlocks need separate consideration. Neither training article substitutes for authorized tool service procedures.
Documentation-Only Practical Lab
Use a spreadsheet, calculator or notebook instead of a physical chamber. Create three fictional data sets for a 30 L vessel: one approximately linear pressure rise, one with a decreasing slope, and one mixed pattern. Document the assumed pressure samples and calculate the apparent gas throughput for an interval in each. Then write a brief fault classification: “compatible with steady ingress,” “compatible with changing gas evolution,” or “insufficient evidence.” Do not equate these descriptions with confirmed leak locations.
For the original worked example, reproduce 30 L × [(8.0 × 10⁻⁴ − 2.0 × 10⁻⁴) mbar / 600 s] and verify the result of 3.0 × 10⁻⁵ mbar·L/s. Convert the result to Pa·m3/s using the factor 0.1. Repeat the calculation after doubling the assumed volume to observe why volume knowledge matters: at the same observed pressure slope, calculated throughput doubles.
Knowledge Check and Explained Answers
- What is a real vacuum leak? A physical flow path permitting gas to enter or escape the vacuum boundary under the relevant pressure differential.
- Why is a high base pressure not by itself evidence of a hole? Gas desorption, trapped volumes, permeation, pump performance and gauge faults may also affect pressure.
- What does the pressure-rise calculation measure? The apparent total gas throughput of the assumed isolated volume under the stated conditions.
- What is the hypothetical result for a 30 L chamber and a 6 × 10⁻⁴ mbar rise in 600 seconds? 3 × 10⁻⁵ mbar·L/s.
- When is helium tracer spray conceptually appropriate? For an approved evacuated system where incoming tracer can be detected through a physical leak path.
- What does a sniffer measure? A tracer signal sampled outside an approved, suitably pressurized part when tracer is escaping.
- Why does a nearly straight pressure curve not prove leakage? Some outgassing processes and temperature-dependent effects can approximate steady rates over limited periods.
- Should a technician raise chamber pressure or disable an interlock to perform a classroom check? No. All physical testing requires applicable engineering approval, equipment limits and qualified personnel.
Primary References and Next Lesson
Primary vacuum-technology documentation: Leybold, Pressure Rise and Drop Tests; Leybold, Definition and Measurement of Vacuum Leaks; Pfeiffer Vacuum, Leak Detection Technology; and Agilent, UHV Tutorial Series. All formulas and demonstrations must be applied using the manufacturer’s current model-specific instructions and the facility’s operating limits.
The next semiconductor-engineering track lesson is selected separately through the live curriculum inventory. Readers should retain one central distinction from OSSTC.016: an observed pressure symptom, a hypothesized cause and a confirmed physical defect are three different levels of evidence.
Editor’s Note: OSSTC.016 follows the published OSSTC.015 chapter. The 30 L worked example and unit conversion were independently recalculated; no chamber was isolated, no detector operated, and no helium gas was released for this lesson. The 1200 × 630 featured cover is a conceptual AI-generated editorial illustration, not an equipment test photograph. Both in-story diagrams are original educational graphics, not process traces or installation procedures. The video titles, publishers and dates were reviewed against available source records; live playback requires separate verification.

To scan the 5,000-sat donation QR on a phone, open the article on a computer or second screen and scan it using a compatible Bitcoin wallet. Some wallets support scanning an image stored on the same phone. Always verify the destination before authorizing payment.
We volunteer daily to ensure the information on this platform is Verifiably True. If you would like to support the research, please scan the QR code.
BitcoinVersus.tech is not a financial advisor. This media platform reports on financial subjects purely for informational purposes.


Leave a Reply