NVIDIA researchers report an approximately 80% drop in robot-planning model-pipeline latency using VFlash, a method that generates spatial coordinates in parallel instead of writing them one token at a time. A November 5, 2026 research paper records 3,552.7 milliseconds per step for conventional autoregressive generation on Jetson AGX Thor against 703.3 milliseconds for VFlash. The 5.05× improvement belongs to a controlled inference benchmark, not verified factory robot movement.
Visual planning converts camera observations and instructions into usable spatial outputs: target boxes, three-dimensional points, or trajectories for moving a gripper. Ordinary vision-language models (VLMs) can spend most of their processing time emitting numerical coordinates sequentially. NVIDIA’s VFlash research system first identifies a primitive’s structure and length, then uses a lightweight drafter to predict a complete coordinate block in parallel. Text instructions still undergo model verification.
Fivefold pipeline acceleration
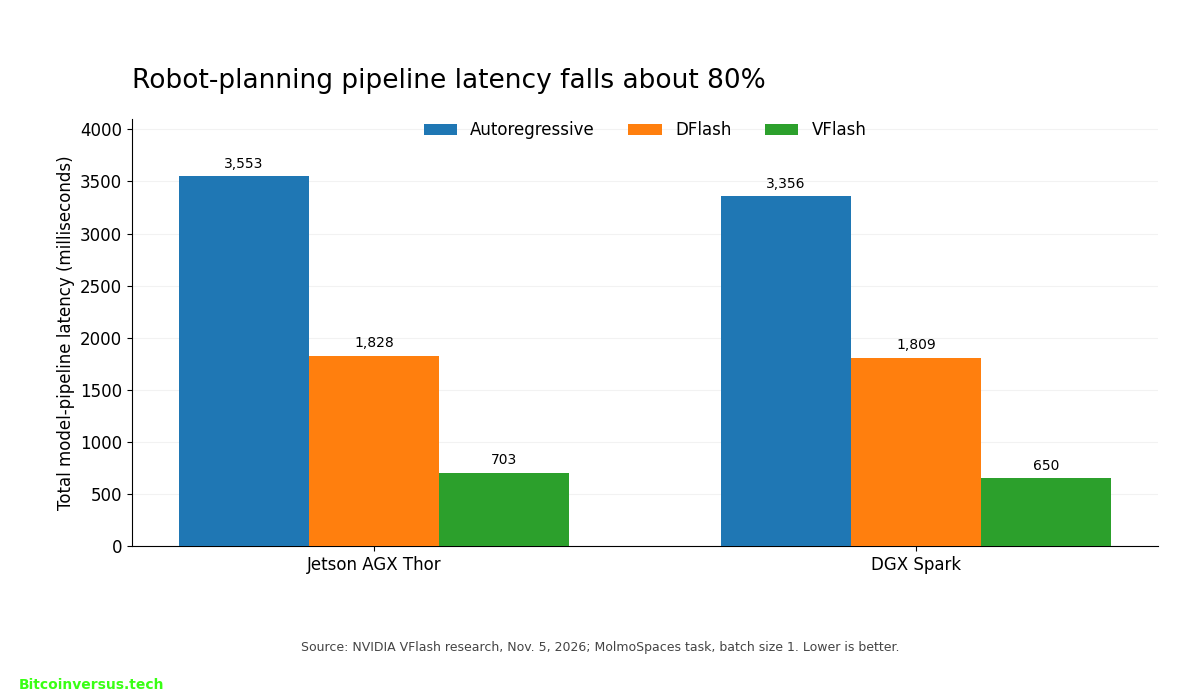
NVIDIA measured three decoding approaches under the same MolmoSpaces robot-planning configuration. On Jetson Thor, conventional generation required 3,552.7 ms; DFlash needed 1,828.4 ms; VFlash finished in 703.3 ms. On DGX Spark the corresponding totals were 3,356.5, 1,809.2 and 649.9 ms. Relative reductions for VFlash were 80.2% and 80.6%. Both comparisons use batch size one and platform-specific optimized runtimes. Measured pipeline latency is not identical to physical motion time or robotic production throughput.
Decoding accounts for most of the saved time
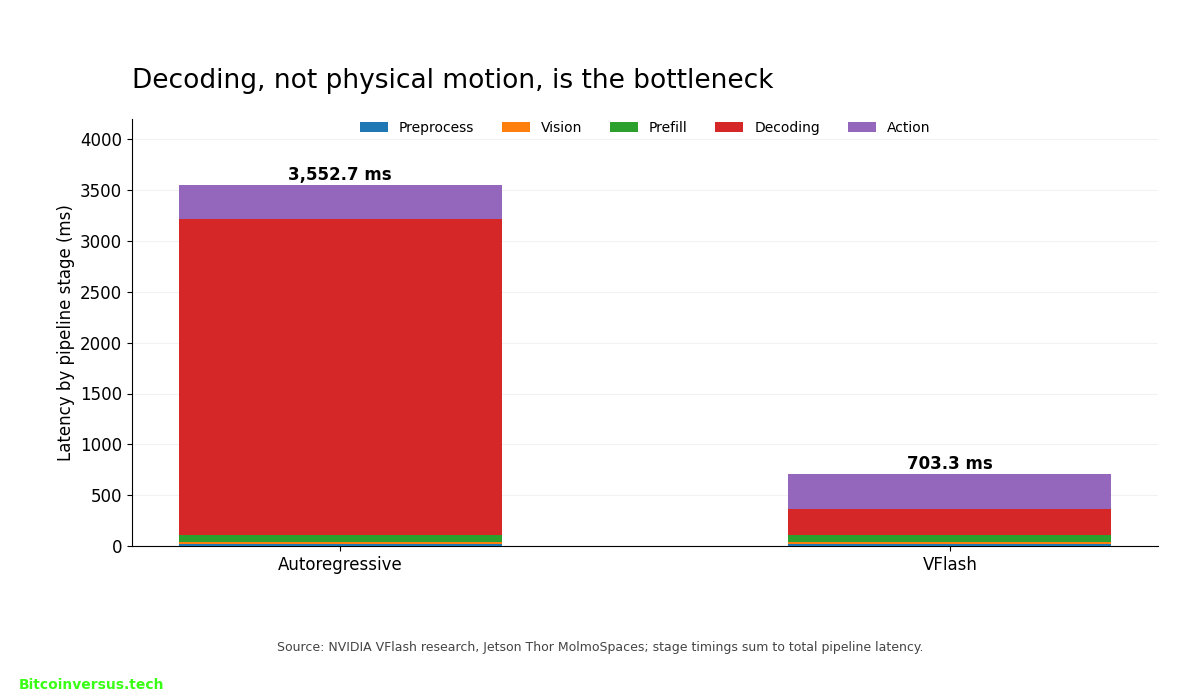
The Jetson Thor breakdown identifies the main bottleneck. Autoregressive decoding used 3,107.6 ms, versus 258.2 ms with VFlash, about 12.0× faster for the decoding stage. Preprocessing, vision encoding, prefill and the action model collectively account for another 445.1 ms in each reported pipeline. As a result, a 12× decoding gain yields only a roughly 5.1× overall pipeline improvement. More complete explanations of path generation appear in BitcoinVersus.Tech’s robot trajectory-planning lesson.
Faster plans also improved task success
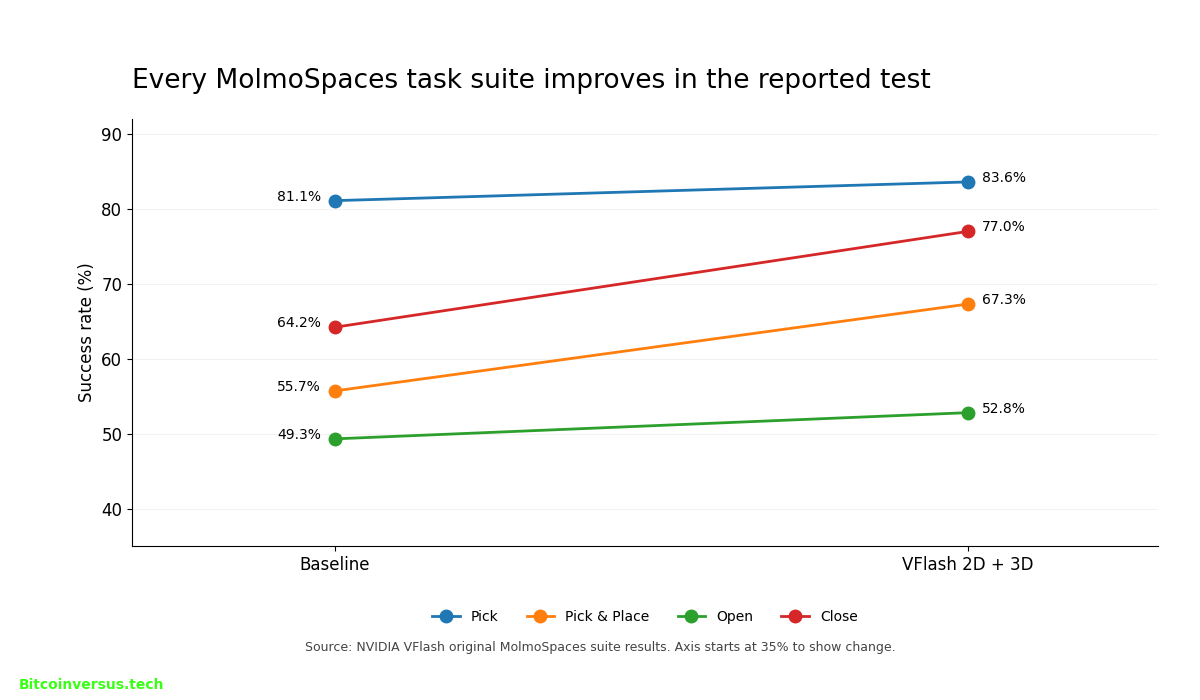
Speed is only useful when robot motions remain accurate. In NVIDIA’s four-suite MolmoSpaces evaluation, a baseline world-action model succeeded 62.6% of the time on average, while VFlash with two- and three-dimensional plans achieved 70.2%. The difference is 7.6 percentage points, or approximately 12.1% relative to the baseline. Autoregressive plans in the same action-model architecture scored just 61.0%, underscoring that adding visual planning without good geometry can harm performance.
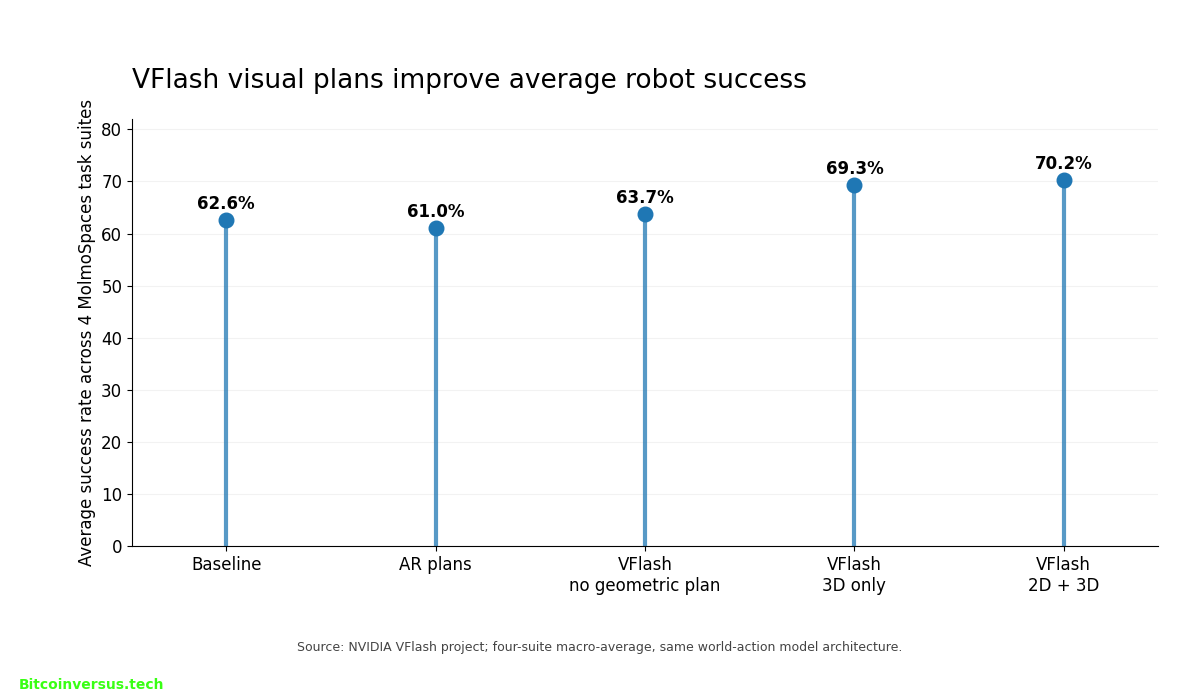
The improvement was not uniform: Pick rose from 81.1% to 83.6%; Pick-and-Place from 55.7% to 67.3%; Open from 49.3% to 52.8%; and Close from 64.2% to 77.0%. The suite scores are model-benchmark observations, not success rates for commercial deployments. NVIDIA’s related physical-AI platform work and independent robot simulation datasets illustrate the wider push to close the gap between research policies and reliable machines.
What has not been proven
The timing tests used customized TensorRT-Edge-LLM implementations with batch size one. Researchers excluded model loading, engine preparation, file loading and additional processing outside their defined timing boundary. The report also describes approximately 25× faster three-dimensional point-motion generation in preliminary single-rollout measurements; results should not be generalized to all tasks or hardware. No independently audited factory uptime, energy-per-completed-task, human safety or total system cost was reported.
The project addresses a real obstacle for automation: a robot that predicts a trajectory too slowly may be unable to update its plan as surroundings change. However, mechanical speed limits, sensors, actuators, control software and safety systems remain separate constraints. Existing robotic connector-insertion experiments show why millimeter-level physical alignment matters, while AI infrastructure reliability adds another operational layer.
Verdict
The peer-reviewed status of the November 5 preprint is not established, but its authors provide transparent benchmark settings and per-stage measurements. The data support a substantial reduction in measured VLM planning latency and a narrower success-rate improvement on the selected suites. Further hardware-independent replication and continuous real-world trials are needed before operators can claim proportional gains in shipped products or factory output.
Editor’s Note
Results originate from NVIDIA-authored VFlash research dated November 5, 2026, including a preprint and its companion project page. Latency figures reflect instrumented model-pipeline stages under stated hardware and batch-size conditions. MolmoSpaces success rates are averages across four evaluated suites; reported percentages do not establish field performance. The cover is an AI-generated conceptual factory illustration, not a photograph from the study. Original charts reproduce published observations, not independent benchmark runs. No YouTube playback test was attempted because no verified official video was included.
Support BitcoinVersus.Tech
Independent research is supported through voluntary donations. To contribute an optional 5,000 satoshis, scan the original BitcoinVersus.Tech QR code with a compatible Bitcoin wallet. On mobile, display the QR on another screen or use the wallet’s supported image-scanning feature. Confirm the destination and amount before transmitting funds.

We volunteer daily to ensure the information on this platform is Verifiably True. If you would like to support the research, please scan QR code.


Leave a Reply