Elementary Overview
A data center can be designed with redundant power, redundant cooling, monitored controls, and a successful commissioning program and still suffer outages if the operating organization cannot prevent, detect, isolate, repair, and learn from failures. Reliability engineering is the discipline that turns good design into dependable operation over years of real maintenance, equipment aging, human intervention, software changes, and unexpected faults.
This lesson builds directly on redundancy and failure domains, capacity planning, cooling engineering, the electrical power path, and BMS, EPMS, DCIM, SNMP, Modbus, alarms, and trending. The goal now is to measure how often systems fail, how quickly they recover, how failures propagate, and how engineering process reduces future risk.
Reliability, Availability, Maintainability, and Resilience Are Different
Reliability asks how consistently a component or system performs its required function without failure over a period of time. Availability asks how much of the time the service is actually usable. Maintainability asks how quickly and safely failed equipment can be restored. Resilience asks whether the larger service can continue or recover when failures happen.
A component can be highly reliable but difficult to repair. Another component can fail more often but be replaced in minutes. A data center can therefore achieve strong service availability through a combination of dependable equipment, redundant architecture, rapid detection, spare parts, trained staff, documented procedures, and fault isolation.
Availability Connects Failure Frequency to Repair Time
A common simplified steady-state relationship is Availability ≈ MTBF ÷ (MTBF + MTTR). MTBF is Mean Time Between Failures. MTTR is commonly Mean Time To Repair or Mean Time To Restore, depending on the organization’s definition.
If a system averages 10,000 hours between failures and takes 2 hours to restore after each failure, the simplified availability estimate is 10,000 ÷ 10,002, or about 99.98%. That number is useful, but engineers should not mistake it for a complete model of facility risk. Common-cause failures, maintenance mistakes, hidden dependencies, cascading faults, and correlated failures can dominate real outages.
MTBF Measures the Time Between Repairable Failures
Mean Time Between Failures is commonly used for repairable equipment. It is calculated conceptually as total operating time divided by the number of failures observed. If ten identical pumps accumulate 100,000 operating hours and experience ten relevant failures, the observed MTBF is 10,000 hours.
MTBF is a population statistic, not a countdown clock. A 100,000-hour MTBF does not mean one specific UPS module will run for exactly 100,000 hours before failing. Reliability data is most useful when engineers also understand failure modes, environmental conditions, maintenance history, loading, age, and whether the equipment population is truly comparable.
MTTR Measures Recovery Speed
Mean Time To Repair can be expressed as total repair time divided by the number of repairs. AWS defines MTTR as the average time taken to respond to and repair a disrupted service or system, including detection, diagnosis, and resolution depending on the selected definition. The important engineering rule is to define exactly what starts and stops the clock before comparing numbers.
Data-center MTTR can be reduced through better monitoring and alarms, accurate asset records, accessible isolation points, trained responders, spare parts, vendor support, remote-management capability, and procedures that have already been tested rather than invented during an outage.
Do Not Let One Average Hide the Incident
Averages can hide distribution. One ten-hour outage and nine ten-minute events can produce a deceptively moderate average. Engineers should therefore examine individual incidents, percentiles, maximum restoration time, affected capacity, customer impact, failure category, and recurrence—not only one MTTR number.
The same caution applies to availability percentages. A site can report strong annual uptime while still suffering one unacceptable high-impact outage. Reliability engineering asks not only “how much downtime?” but also what failed, why it failed, what else depended on it, and whether the same mechanism can happen again.
Failure Domains Turn Component Failures Into System Questions
The failure-domain question is: what else can this one failure take down? A breaker can affect one PDU, one row, one room, or an entire building depending on architecture. A cooling valve can isolate one CRAH coil or create a larger loss of cooling if multiple units share the same header and control dependency.
Good reliability engineering maps these dependencies before an incident. Electrical one-lines, mechanical flow diagrams, network topology, control architecture, neighbor-discovery data, rack elevations, and asset databases should agree on where a fault begins and where its blast radius ends.
FMEA Asks How Each Failure Can Hurt the System
Failure Modes and Effects Analysis, or FMEA, is a structured method for asking what can fail, why it can fail, what effect that failure creates, how the failure is detected, and what controls reduce the risk. A data-center FMEA may include utility loss, ATS failure, generator failure to start, UPS module failure, battery degradation, PDU breaker trip, switch failure, pump loss, valve failure, fan failure, sensor drift, controller loss, or network communication failure.
The strongest FMEA work ties directly to the real power path and cooling topology. Generic rows such as “UPS fails” are less useful than specific failure modes such as “one UPS module fails open while the remaining modules are above N capacity during maintenance.”
Severity, Occurrence, and Detectability Help Prioritize Risk
Traditional FMEA often scores severity, occurrence, and detectability. Some teams multiply the three scores into a Risk Priority Number. RPN can help rank work, but engineers should not use one multiplied number as the only decision rule because different failure combinations can produce the same score while carrying very different consequences.
A low-frequency failure that can simultaneously remove both A and B power paths may deserve more attention than a frequent fan alarm with almost no service impact. Criticality, common-cause exposure, safety, business consequence, recovery complexity, and regulatory requirements should remain visible alongside any numerical scoring method.
Preventive Maintenance Changes the Failure Probability
Preventive maintenance is scheduled work intended to reduce the chance of failure or discover degradation before service is lost. Examples include battery testing, breaker exercising, infrared inspections, generator load testing, fluid analysis, filter replacement, fan inspection, torque checks, firmware review, and sensor calibration.
Maintenance is not automatically risk-reducing in the moment. Opening a redundant electrical path for service temporarily changes the facility from its normal configuration. That is why concurrent maintainability and change control matter: the system must remain able to support the critical load while one planned component or path is unavailable.
Maintenance Windows Are Temporary Reliability States
A maintenance window should be treated as a deliberate change in system risk. Before work starts, the engineer should know the current load, remaining redundancy, affected failure domains, active alarms, weather or utility concerns, staffing, spare parts, vendor availability, rollback criteria, and exactly which loads could be exposed if another failure occurs.
A site that is normally 2N may temporarily behave like N during certain maintenance activities. A nominally N+1 cooling plant can lose its spare margin when one chiller is isolated. The correct question is therefore not only “is the maintenance approved?” but what architecture exists while the maintenance is in progress?
MOP, SOP, and EOP Solve Different Operational Problems
A Method of Procedure, or MOP, is typically a step-by-step plan for a specific controlled activity or change. A Standard Operating Procedure, or SOP, describes the normal repeatable way an operation is performed. An Emergency Operating Procedure, or EOP, gives responders a prepared path for abnormal or emergency conditions.
A strong MOP identifies prerequisites, personnel, communications, equipment state, exact steps, expected indications, hold points, backout or rollback criteria, safety requirements, and post-work validation. Reliability comes from reducing ambiguity before the hands-on work begins.
Change Control Prevents Two Good Changes From Becoming One Bad Outage
Data centers are complex enough that independent teams can create interacting risk. Facilities may be servicing a UPS while network engineering changes switch software and server teams migrate workloads. Each individual activity may be reasonable, yet the combined state can remove multiple layers of redundancy at once.
Change control creates a shared operational picture: what is changing, when it is changing, who owns it, what systems are affected, what alarms are expected, how success is verified, and how the site returns to the previous safe state if results differ from the plan.
Monitoring Must Prove the Change Did What the Procedure Expected
Every important step in a MOP should have an expected observation. If a breaker opens, what should the EPMS show? If a pump is isolated, what happens to differential pressure and supply temperature? If a network path is moved, what should SNMP or interface telemetry show?
Time alignment also matters. The facility’s BMS, EPMS, servers, network devices, and security systems should have consistent timestamps so event order can be reconstructed. BitcoinVersus.Tech’s NTP explainer shows why synchronized clocks are foundational when engineers correlate logs across multiple systems.
Root Cause Analysis Starts After Service Is Stabilized
During an active incident, the priority is safe stabilization and restoration. Root Cause Analysis, or RCA, comes after the system is under control and the evidence has been preserved. Good RCA reconstructs the event timeline, identifies direct causes and contributing conditions, tests alternative explanations, and converts findings into corrective actions.
Do not confuse the first failed component with the full root cause. A breaker may trip because it is defective, because a downstream short occurred, because protection settings were wrong, because maintenance introduced a tool or conductor, or because the system was operated outside its intended configuration. The failed component is evidence; the causal chain explains the incident.
Preserve Evidence Before Resetting Everything
Before clearing alarms or power-cycling controllers, capture relevant logs, waveforms, relay targets, BMS trends, EPMS events, breaker states, temperatures, pressures, network telemetry, photographs, timestamps, and operator observations. Once a controller is reset or a breaker is reclosed, some of the best evidence can disappear.
This is the same principle used in server hardware troubleshooting: preserve the event log before clearing it. Reliability engineering extends that discipline across the whole facility.
Blameless Does Not Mean Accountability-Free
A useful RCA focuses on how the system allowed an error to become an outage. If one technician can accidentally remove both redundant paths with one command, the lesson is not only “the technician made a mistake.” The engineering questions include why the interface allowed it, why the MOP did not prevent it, why the peer check missed it, and why alarms or interlocks did not stop the sequence.
Accountability still matters. Procedures must be followed, qualifications must be maintained, and unsafe actions must be addressed. The reliability objective is to avoid stopping the analysis at individual blame when process, design, tooling, training, supervision, or architecture also contributed.
Corrective Actions Must Change the Future System
An RCA is incomplete if the only output is a document. Corrective actions might modify protection settings, add an alarm, improve labeling, rewrite a MOP, alter a maintenance interval, add a spare, redesign a failure domain, update a control sequence, improve trending, or create a new test in the next commissioning or integrated-systems exercise.
The highest-value lesson is often the one that turns an incident into a permanent design or process improvement. Reliability increases when yesterday’s failure becomes tomorrow’s guardrail.
Reliability Testing Should Be Incremental
High-impact fault testing should move from low-risk environments toward higher-risk production states only as evidence accumulates. Meta described a 2026 program that progressively tested instantaneous regional power loss, beginning with contained environments and eventually validating large production regions. The engineering principle is broadly applicable: test failure behavior in controlled stages before assuming the design will recover correctly at full scale.
This connects directly back to Integrated Systems Testing. Commissioning proves the new facility behaves as designed. Ongoing reliability programs periodically prove that the operating facility still behaves correctly after years of modifications, firmware changes, replacements, and maintenance.
A Practical Reliability Review
- Define the critical service and the failure domains that support it.
- Review current load against capacity and redundancy headroom.
- Identify major electrical, mechanical, control, and network failure modes.
- Verify that each important failure has a detection method.
- Measure failure frequency and restoration time using consistent definitions.
- Review preventive-maintenance history, overdue work, and recurring alarms.
- Confirm spare-parts strategy and vendor-response expectations.
- Audit MOPs, SOPs, and EOPs against the current facility—not the original drawings.
- Review change windows for overlapping risk.
- Verify BMS/EPMS/DCIM, server, and network timestamps are synchronized.
- Sample completed RCAs and confirm corrective actions were actually closed.
- Feed lessons learned back into commissioning scripts, training, design standards, and future projects.
Worked Example: UPS Maintenance With One Unexpected Failure
Assume a 2N electrical design normally supports the IT load through independent A and B UPS paths. During planned maintenance, the A UPS path is intentionally isolated. The critical load remains on B, so service is still operating, but the facility is temporarily in a reduced-redundancy state.
If the remaining B path now experiences a breaker trip, the incident is not simply “a breaker failed.” The reliability analysis asks why the B-side failure occurred during the A-side maintenance window, whether load transfer or bypass options were available, whether the maintenance window should have been paused due to warning signs, whether alarms gave enough lead time, whether the MOP correctly described the reduced failure tolerance, and whether another activity created a common-cause condition.
Exercises
- Explain the difference between reliability and availability.
- A system records 20,000 operating hours and four failures. Calculate its observed MTBF.
- A team spends 12 total hours repairing six incidents. Calculate the observed MTTR.
- Explain why MTBF is not a prediction of the exact lifetime of one component.
- Choose one component from the data-center power path and write three realistic failure modes for an FMEA.
- Describe how preventive maintenance can temporarily increase operational risk.
- Explain the difference between a MOP, SOP, and EOP.
- Create a five-item evidence list that should be captured before resetting a failed controller.
- Explain why synchronized timestamps improve RCA quality.
- Describe one corrective action that changes design and one that changes process.
Knowledge Check + Answers
- What does MTBF measure? The average operating time between relevant failures for a repairable system or population.
- What does MTTR measure? The average restoration or repair time, using the organization’s explicitly defined start and end points.
- What does FMEA do? It identifies failure modes, effects, detection methods, and controls so risk can be understood before the failure occurs.
- Why is a maintenance window a reliability event? Because taking equipment out of service temporarily changes redundancy and the facility’s tolerance for another fault.
- What is the purpose of a MOP? To provide a controlled, step-by-step method for a specific planned activity or change.
- When should RCA begin? After the incident is safely stabilized and evidence is preserved.
- Why is “operator error” usually an incomplete root cause? Because reliability engineering also examines design, procedure, interface, training, supervision, interlocks, and organizational conditions that allowed the error to create impact.
- What makes a corrective action valuable? It changes the future system so the same failure is less likely, easier to detect, less damaging, or faster to recover from.
Prior Lessons and References
- OSDCEC.001 — Data Center Redundancy and Failure Domains
- OSDCEC.002 — Data Center Capacity Planning
- OSDCEC.003 — Data Center Cooling Engineering
- OSDCEC.004 — Data Center Electrical Power Path
- OSDCEC.005 — Data Center Monitoring and Controls
- OSDCEC.006 — Data Center Commissioning
- AWS — What Is MTTR?
- Meta Engineering — Validating Instant Power Loss Readiness
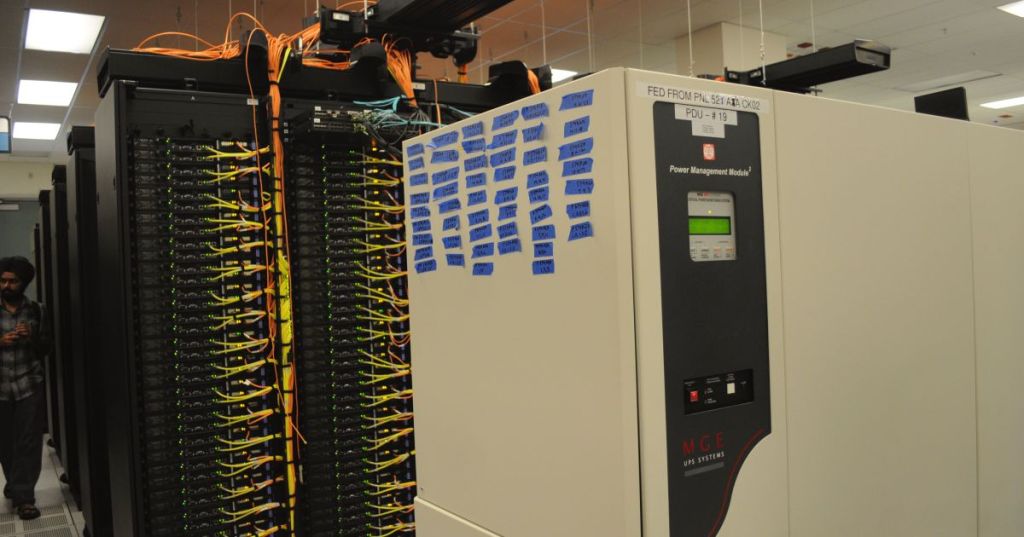
- Featured source photo — NERSC data center, Wikimedia Commons, CC0/public-domain dedication; cropped to 1200×630.
Elementary Conclusion
Data-center reliability engineering connects design, maintenance, monitoring, incident response, and organizational discipline. MTBF helps describe failure frequency. MTTR helps describe recovery speed. FMEA helps anticipate how equipment and systems can fail. MOPs, SOPs, EOPs, and change control reduce operational ambiguity. RCA turns failures into engineering improvements.
The central idea is simple: redundancy is only potential reliability until the organization can maintain, test, operate, and recover that redundancy correctly. The best data-center engineers design for failure, measure what actually happens, and continuously feed operational evidence back into the facility.
BitcoinVersus.Tech
Advertisement
BitcoinVersus.Tech publishes open technical education across data centers, electrical systems, networking, servers, semiconductors, robotics, and software.
Editor’s Note
Reliability metrics and maintenance procedures must be defined for the exact facility, equipment, safety program, and operating model. Follow approved site procedures, OEM documentation, electrical-safety requirements, and change-control rules before modifying production infrastructure.
We volunteer daily to help keep the information on this platform verifiably accurate. Support our independent research through the support options available on BitcoinVersus.Tech.
BitcoinVersus.tech is not a financial advisor. Content is provided for informational purposes.


Leave a comment