Dominion Energy Virginia now reports approximately 54.9 gigawatts of data-center capacity in various contracting stages, up a company-reported 13% since December 2025. But the most consequential figure in the utility’s October 30, 2026 earnings presentation is smaller: only 12.2 GW has reached an electric service agreement, the stage specifying how customers take service and pay associated charges. The distinction separates a massive development pipeline from signed service commitments—and from actual electricity consumption.
Virginia’s data centers need utility transformers, transmission connections and substations long before servers operate. A megawatt measures power capacity; a megawatt-hour measures energy over time. Adding capacity requests together does not establish how much electricity facilities are currently using. BitcoinVersus.Tech’s AI campus power rankings likewise distinguish planned IT power from energized, operating infrastructure.
Three stages with different financial commitments
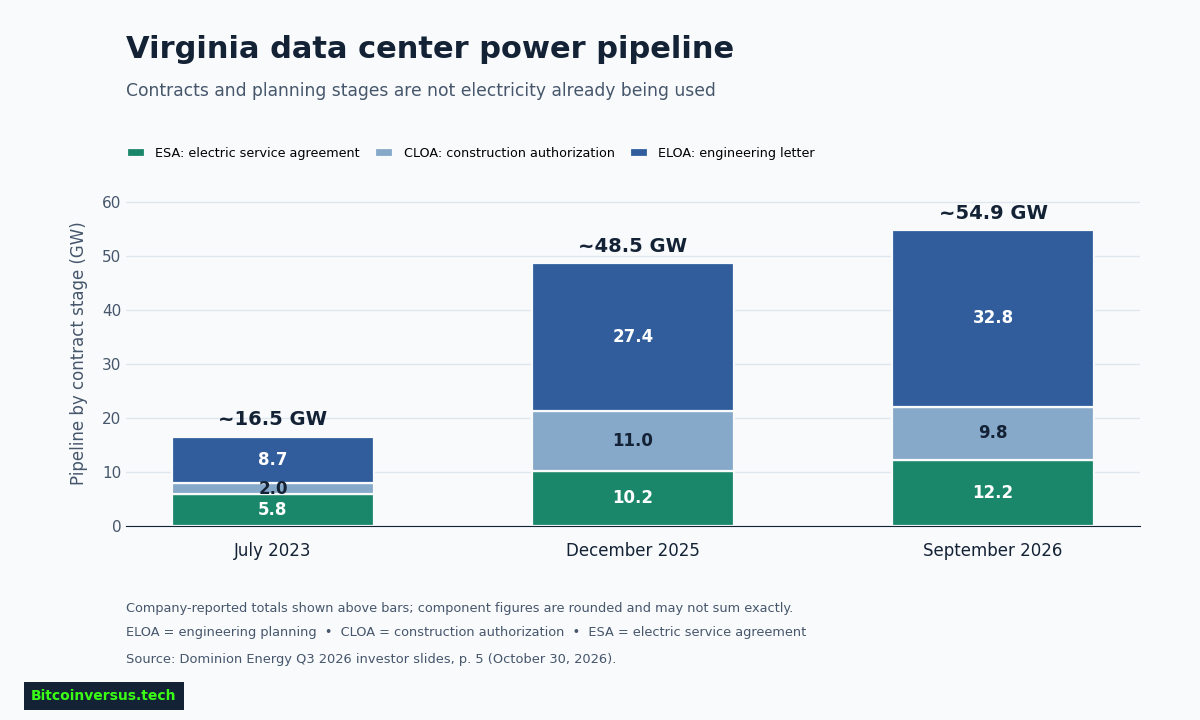
Dominion’s investor slide breaks September’s pipeline into 32.8 GW of Engineering Letters of Authorization (ELOA), 9.8 GW of Construction Letters of Authorization (CLOA) and 12.2 GW of Electric Service Agreements (ESA). Engineering letters authorize detailed planning, with engineering costs reimbursed. Construction letters authorize construction and require repayment of spent costs if customers withdraw. Electric service agreements include revenue obligations whether or not the customer actually takes power.
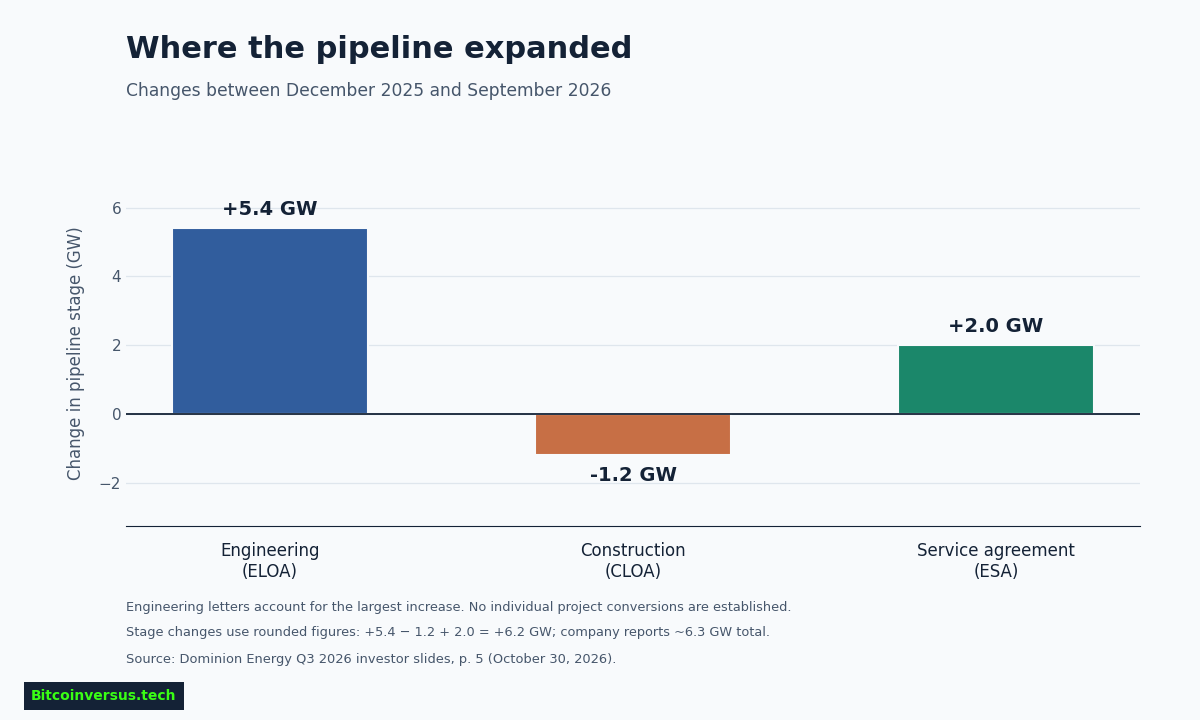
Using the disclosed total, the ESA stage represents approximately 22.2% of 54.9 GW (12.2 ÷ 54.9 × 100). Engineering-stage capacity alone represents approximately 59.7%. The calculations describe contractual maturity—not probability of completion, active demand or delivered generation. The three published category figures sum to 54.8 GW rather than 54.9 GW because Dominion rounded its disclosures.
Growth has concentrated in earlier-stage projects
From December 2025 through September 2026, engineering letters increased from 27.4 to 32.8 GW, a 5.4 GW rise. Construction authorizations decreased from 11.0 to 9.8 GW, while signed service agreements increased from 10.2 to 12.2 GW. The changing buckets are consistent with projects entering or progressing through the pipeline, but the published totals do not identify individual conversions or cancellations.
For longer perspective, the utility recorded approximately 16.5 GW across the same stages in July 2023, compared with roughly 48.5 GW in December 2025. Growth at such scale puts pressure on regional transmission planning and cost allocation. BitcoinVersus.Tech has reported on AEP’s transmission engineering program and grid-fault safeguards for AI infrastructure, two related engineering challenges.
Who pays for the grid expansion?
Dominion executives said their Virginia large-load rate framework seeks to protect existing customers from stranded investments and inappropriate cost shifting. Such protections depend on the eventual tariffs, contract provisions and regulatory enforcement. Long-lived utility assets can require financing before prospective projects begin consuming power, creating uncertainty for planners and ratepayers.
The 54.9 GW pipeline is consequently a leading indicator of developers’ interest, not a forecast of 54.9 GW continuously drawn from the grid. Commission approvals, construction schedules, transformer availability, local permitting and customer economics could change the eventual energized load. On-site fuel-cell procurement illustrates one alternative route to powering future facilities, but purchase agreements likewise should not be confused with delivered electricity.
Dominion’s most defensible near-term milestone is not the headline pipeline total: it is the conversion of early-stage requests into signed, financed and ultimately metered service. Subsequent company presentations, grid-operator filings and utility commission records will determine how much of Virginia’s reported pipeline becomes operating infrastructure.
Primary references: Dominion Energy Q3 2026 earnings slides (October 30, 2026), page 5; Dominion third-quarter results; Dominion’s September 30, 2026 Form 10-Q. For independent context: Data Center Dynamics, November 3, 2026.
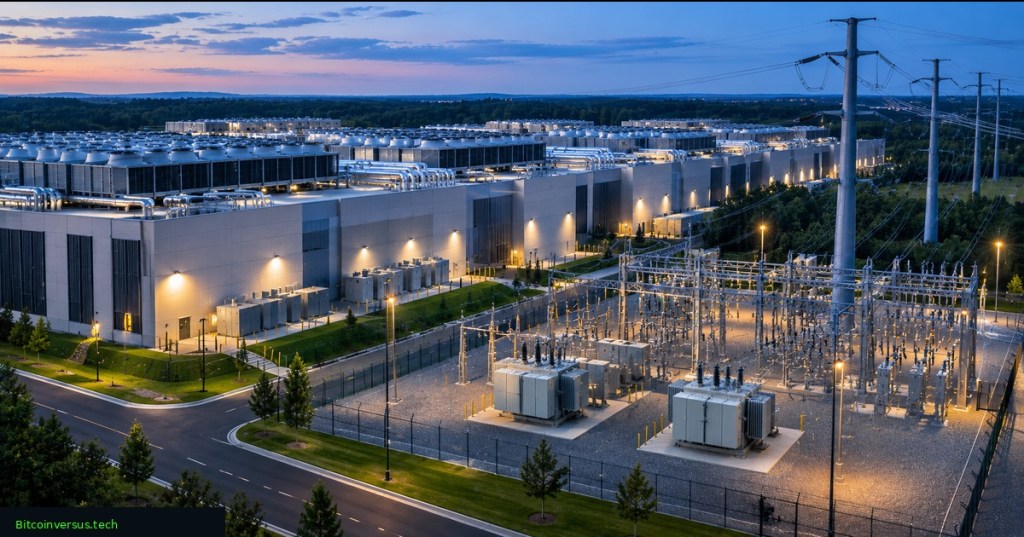
Editor’s Note: The approximately 54.9 GW figure comprises engineering, construction authorization and electric service agreement stages, and must not be read as operating data-center load. Company-reported component values are rounded, explaining slight differences in calculated totals and changes. The cover is conceptual artwork, not a photograph of a specific Dominion facility. The WJLA video provides earlier regional context and does not verify the October financial disclosure. Independent playback and hands-on cross-device rendering were not established at publication.
Support BitcoinVersus.Tech
For an optional 5,000-satoshi donation, use the original approved QR image below. On a phone, open the article on a second display and scan it with a compatible Bitcoin wallet, or use the wallet’s supported image-scanning function. Verify the recipient address and amount before sending funds.

We volunteer daily to ensure the information on this platform is Verifiably True. If you would like to support the research, please scan QR code.


Leave a Reply